
FIGURE
Fig. 9
Fig. 9
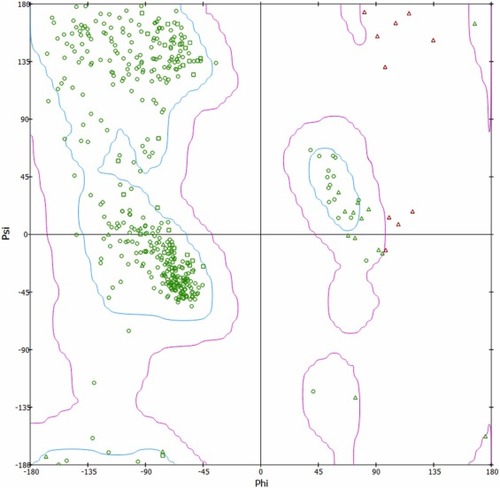
Fig. 9. Ramachandran plot of the protein (5M8M) obtained from Biovia Discovery Studio. The blue region represents the favored region, while the pink region is the allowed region. Green circles and triangles are protein residues that are within the favoured and allowed region, while the red triangles represent protein residues that are in the outlier regions.(For interpretation of the references to colour in this figure legend, the reader is referred to the web version of this article.) |
Expression Data
Expression Detail
Antibody Labeling
Phenotype Data
Phenotype Detail
Acknowledgments
This image is the copyrighted work of the attributed author or publisher, and
ZFIN has permission only to display this image to its users.
Additional permissions should be obtained from the applicable author or publisher of the image.
Full text @ Biomed. Pharmacother.