
- Title
-
Autophagic degradation of LOX-1 is involved in the maintenance of vascular integrity injured by oxLDL and protected by Berberine
- Authors
- Zheng, Y., Chen, B., Zhang, M., Ma, Y., Wang, L., Zhang, J., Jiang, J.
- Source
- Full text @ Int. J. Biol. Sci.

Effects of BBR on the HCF-induced disorders of lipid metabolism in zebrafish larvae. A Attenuation of the HCF-induced lipid accumulation by BBR, as indicated by whole-body ORO staining (n = 20). Colored ovals indicate the following tissues: heart (yellow oval circle), liver (blue oval circle), brain (black oval circle), and trunk vessels (green oval circle). The scale bar represents 200 μm. B Total cholesterol (TC) and total triglycerides (TG) were reduced at the administered concentration of BBR. Samples were collected from 20 zebrafish and tested in triplicate. C Abnormal BMI was corrected by BBR treatment. The BMI was calculated as the ratio of body weight (kg) to body length squared (m2) (n = 10). D BBR-related reduction of high-cholesterol-induced lipid accumulation in liver in both paraffin sections with hematoxylin-eosin staining (HE staining, upper panel) and frozen sections with ORO staining (lower panel) (n = 10). The scale bars represent 15 μm. BBR concentration was 20 μM in (C) and (D). #P < 0.05 vs HCF. BBR: berberine; HCF: high-cholesterol food; and ORO: Oil Red O; ATC: Atorvastatin (positive control). |

BBR attenuated vascular lipid accumulation and vascular occlusion aggravated by LOX-1 in the HCF-treated zebrafish. A Lipid accumulation in blood vasculature and heart was observed by whole-body ORO staining and Nile Red staining (n = 20). ORO-stained blood vessels are observed at the following body parts: the brainstem (yellow oval ring), the heart (pink oval ring), and the trunk (blue rectangle) (left panel). In the Nile Red staining of the Tg(fli1:GFP) larvae, the green fluorescence represents blood vessels, and the red fluorescence indicates lipid deposition (right panel). The bars indicate 300 μm. B Visible pathological changes of blood vessel structure in zebrafish using HE staining of paraffin sections (left panel). The black arrow points at a part of the blocked vessel. BBR (20 μM) and ATC (1 μM) were respectively given to the HCF plus LOX-1 group. Cholesterol deposition (marked by cholesteryl-BODIPY) in blood vessel walls was observed in transgenic zebrafish Tg(fli1:GFP) using a laser scanning confocal microscope (n = 10) (right panel). The bars indicate 100 μm. |

BBR-related inhibition of oxLDL-induced bulge-like proliferation of VSMCs and EMT of VECs. A VSMC migration ability was measured by Transwell assays (scale bar, 200 µm). B Cell immunofluorescence assay confirming the VSMC migration and ectopic expression of VEC and VSMC marker proteins. The antibody against α-SMA protein is labeled with red fluorescence, and the anti-VE-cadherin antibody is labeled with green fluorescence (scale bar, 50 μm). C Western blot results show the levels of VE-cadherin and α-SMA proteins affected by the different treatments. The western blot results from the co-culture condition were semi-quantitatively analyzed, and the data are presented in Fig. S3C (n = 5). The used concentrations were 1 μM for BBR and 100 μg/mL for oxLDL. VEC: human umbilical vein endothelial cells; VSMC: human vascular smooth muscle cells. |
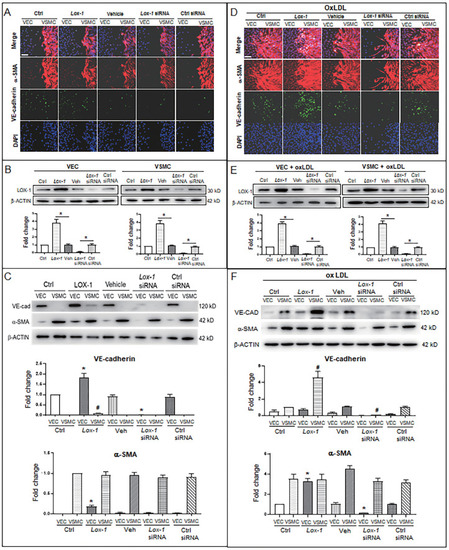
LOX-1 promotes proliferation of VSMCs and ectopic expression of protein markers in VECs and VSMCs. LOX-1 protein was up- or downregulated by transfection of pLOX1-IRES2-EGFP or lox1-siRNA, respectively, in both VECs and VSMCs. A, D Cell immunofluorescence experiments show the extent of proliferation and migration of VECs and VSMCs of the double-cell co-culture in the absence (A) or presence (D) of oxLDL. Red color indicates α-SMA, and green color indicates VE-cadherin. The bars indicate 60 μm in (A) and (D). B, E Western blots show levels of LOX-1 protein after transfection with the LOX-1 overexpression vector and siRNA, respectively in both VSMC and VEC in the absence (B) or presence (E) of oxLDL (n = 5). *P < 0.05.C, F Western blots indicate shifting protein levels of VE-cadherin and α-SMA affected by lox-1 overexpression or siRNA knockdown in the absence (C) or presence (F) of oxLDL (n = 5). *P < 0.05 vs VEC ctrl, #P < 0.05 vs VSMC ctrl. The oxLDL concentration was 100 μg/mL. |

BBR inhibits EMT and decreases LOX-1 via promotion of autolysosomal digestion in VSMCs and VECs. A, B Western blot analysis shows that the autophagy inhibitor CQ blocked BBR's anti-EMT role in VSMCs (A) and VECs (B). *P < 0.05 vs monoculture ctrl of VSMC (A) or VEC (B), #P < 0.05 vs VSMC (A) or vs VEC (B) under VEC-VSMC co-culture plus oxLDL. C, D Co-immunoprecipitation analysis with anti-p62 and anti-LAMP2 antibodies shows the interaction between the autophagy proteins p62, LC3B, and LAMP2 and LOX1 promoted by BBR in VSMCs (C) and VECs (D) under the condition of VEC-VSMC co-culture plus oxLDL. All western blot data were from independent tests (n = 4 or 5). *P < 0.05 vs monoculture ctrl of VSMCs (C) or VECs (D); #P < 0.05 vs co-culture ctrl of VSMCs (C) or VECs (D). |

BBR induction of autolysosome formation in VSMC. A Cell immunofluorescence analysis showing the subcellular co-localization of p62-LC3B, LAMP2-LC3B, LOX-1-LC3B and LOX-1-LAMP2 with their Pearson correlation coefficients and the particle counts (n = 10). The detailed figures of the colocalization particles are shown in Fig. S5A and B. The bars indicate 15 μm. B showing Autophagosomes and autolysosomes in VSMCs under monoculture and co-culture conditions as observed by transmission electron microscopy, and the particle numbers of autophagosomes and autolysosomes are shown in Fig. S5C (n = 20). The BBR concentration was 1 μM, and the oxLDL was 100 μg/mL. Blue boxes indicate representative autophagosomes and red boxes indicate representative autolysosomes or amphisomes, and these structures are enlarged below. The aggregated autophagosomes are shown in the right blue box in the group of co-culture plus oxLDL. |

BBR induction of autolysosome formation in VECs. A Cell immunofluorescence analysis showing the subcellular co-localization of p62-LC3B, LAMP2-LC3B, LOX-1-LC3B and LOX-1-LAMP2 with their Pearson correlation coefficients and particle numbers (n=10), respectively. The detailed figures of the colocalized particles are shown in Fig. S6A and B. The bars indicate 15 μm. B Autophagosomes and autolysosomes in VECs were observed by transmission electron microscopy, and the particle numbers of autophagosomes and autolysosomes are shown in Fig. S6C (n = 20). Blue boxes indicate representative autophagosomes and red boxes indicate representative autolysosomes or amphisomes, and these structures are amplified below. The BBR concentration was 1 μM, and the oxLDL was 100 μg/mL. The bars indicate 5 μm. |
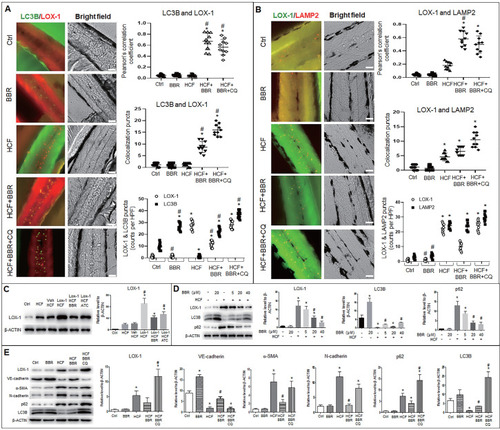
BBR suppresses LOX-1 and EMT by activating autophagy in zebrafish. Whole-mount immunofluorescence experiments were performed to detect co-localization between LOX-1 protein and autophagolysosomal proteins (LC3B and LAMP2). A, B Co-localized particles of LC3B with LOX-1 (A) and LAMP2 with LOX-1 (B) were observed in the HCF plus BBR and the HCF plus BBR plus CQ groups. The results were supported by the Pearson correlation coefficient and counts of the co-localized particles. Respective particle counts of LOX-1, LC3B and LAMP2 showed that LOX-1 protein particles was decreased by BBR treatment, but CQ suppressed the BBR effect compared to the HCF group (n=10). The bars indicate 50 μm. *P < 0.05 vs ctrl, #P < 0.05 vs HCF. The detailed images of LOX-1 co-localization with LC3B and with LAMP2 are shown in Fig. S7 . C Western blot showing LOX-1 protein levels in whole zebrafish in the different treatments. D showing BBR effects on LOX-1 level and autophagy flux in a concentration-dependent manner. E Levels of EMT markers, LOX-1 and autolysosome markers in the different groups in vivo. The data in C-E were from 15-dpf larvae (20 zebrafish) (n = 5). *P < 0.05 vs ctrl, #P < 0.05 vs HCF. |