
- Title
-
Conformational transitions and allosteric modulation in a heteromeric glycine receptor
- Authors
- Gibbs, E., Klemm, E., Seiferth, D., Kumar, A., Ilca, S.L., Biggin, P.C., Chakrapani, S.
- Source
- Full text @ Nat. Commun.
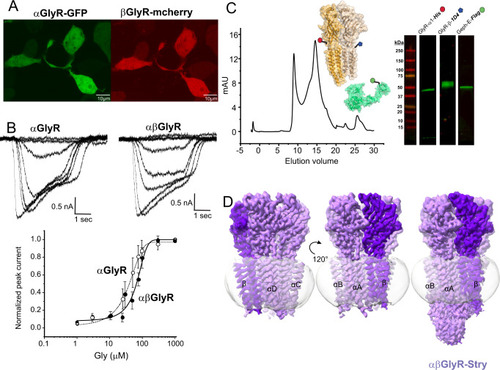
A Confocal fluorescent microscopy images of HEK 293 T cells showing GFP and mCherry expression, which respectively co-expressed with αGlyR and βGlyR subunits, via a bicistronic plasmid. βGlyR was transfected at a 5:1 excess, even though the mCherry fluorescence appears weaker. Generally, transfection efficiency was around 50%, and similar fluorescent images were observed for all cell plates used for electrophysiology. B Whole-cell current recordings from HEK 293 T cells transfected with only αGlyR (left) and with αGlyR and βGlyR (right) in response to glycine (concentration range: 1–1000 μM). Dose–response curves were generated from recordings on different batches of cells. The EC50 for αGlyR was 19 ± 11 μM (n = 5), and for αβGlyR was 63 ± 13 μM (n = 4). Data are presented as mean values ± standard deviation. C αβGlyR (coexpressed with Geph-E) was purified with a two-step affinity purification using subunit-specific affinity tags for βGlyR (1D4) and αGlyR (8xHis) followed by separation using size exclusion chromatography. The main peak (~14.8 ml) was at the elution volume expected for a pentameric assembly, and western blot analysis showed the peak contained all three expressed proteins. Similar gel filtration profiles were consistent for about 20 purifications in the course of this study. D Final cryo-EM reconstructions of αβGlyR-Stry. The density corresponding to the beta subunit is colored in a darker shade of purple. The left and center figures are shown at σ = 0.16, and the rightmost figure is shown at σ = 0.09 to highlight the diffuse ICD signal. |
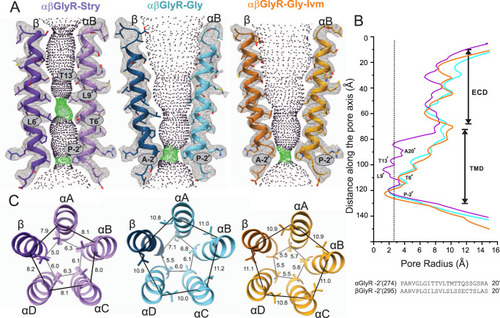
A Map and model representations of M2 helices in the αB and β subunits as seen in αβGly-Stry, αβGly-Gly and αβGly-Gly-Ivm (σ = 0.146, 0.25, and 0.13, respectively). The ion permeation profiles of the channel pore were generated using HOLE85. The side chains lining the constrictions (green dots) are labeled. B The smallest pore radii as a function of the position along the pore axis. The radius of a hydrated chloride ion is indicated as a dotted line and shows that all three states are expected to be non-conducting, though this analysis does not consider hydrophobicity or pore asymmetry. Residues lining the M2 helix for each subunit are shown below the plot. C Top-down views of the L9′ and P-2′ positions which respectively correspond to the channel activation and desensitization gates. Distance labels are in Å. |
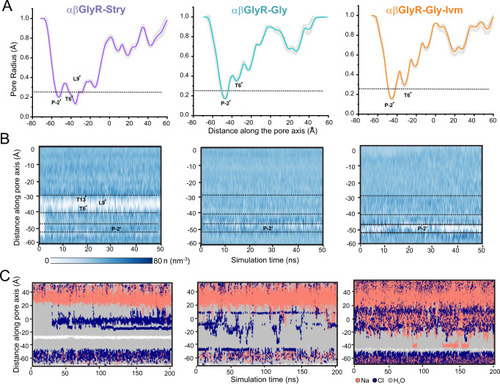
A Mean pore radius profile and standard deviations averaged across 50 ns equilibrium simulations for αβGlyR-Stry (left), αβGlyR-Gly (middle), and αβGlyR-Gly-Ivm (right) along the central pore axis. The one-standard-deviation range is shown as a gray band, and the thick line is the mean of a 50 ns simulation. B Water density within the channel pore. Each discrete water molecule position is associated with a Gaussian distribution, and the sum of all Gaussians yields the density function of water along the channel center line. Bulk water has a density of 33 nm−3. The time series of water density was calculated for 50 ns equilibrium simulations. C Trajectories along the pore axis of water molecules and ion coordinates within 10 Å of the channel axis inside the pore, in the presence of a +500 mV transmembrane potential difference (i.e., with the cytoplasmic side having a positive potential). No chloride permeation was observed past L9′ or P-2′ for αβGlyR-Stry, consistent with a closed channel state. No chloride permeation was observed past P-2′ for αβGlyR-Gly and αβGlyR-Gly-Ivm, consistent with a desensitized channel state. During all simulations, positional restraints were placed on the protein backbone, in order to preserve the experimental conformational state while permitting rotameric flexibility in amino acid side chains. |
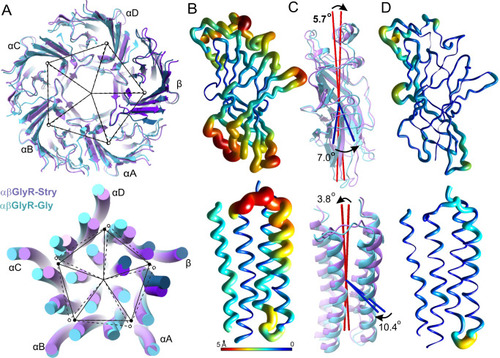
The ECD and TMD were analyzed separately, with respective results shown in the top and bottom rows. A Image overlay showing subunit displacement. The center of mass of each subunit domain is shown as a closed circle for αβGlyR-Stry and an open circle for αβGlyR-Gly. Exact distances and angles between subunits are given in Supplementary Table 6. B Ribbon diagrams of the αA subunit. Thickness and color show the displacement of the main chain atom between αβGlyR-Stry and αβGlyR-Gly. Results are similar for other subunits. C Images showing the motions described by two of the three principal components. These are associated with subunit tilt (red) and rotation (blue). The measured tilt and rotation are generally consistent between subunits, and exact values for each subunit are given in Supplementary Table 7. D Ribbon diagrams showing atomic displacement after correcting for subunit tilt and rotation. Differences highlight conformational changes that are not well-described by the rigid rotation of the subunit domain. |
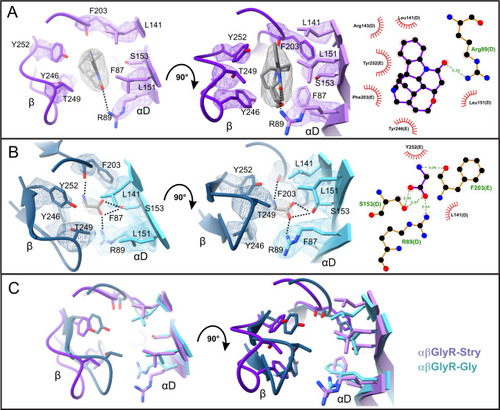
The binding pocket for A strychnine in αβGlyR-Stry and B glycine in αβGlyR-Gly shown at different angles. Map density is shown at σ = 0.3 and σ = 0.55 for strychnine and glycine, respectively. LigPlot analysis is shown on the right. C Overlaid models show structural rearrangements between αβGlyR-Stry and αβGlyR-Gly. Ligands are omitted for clarity. |
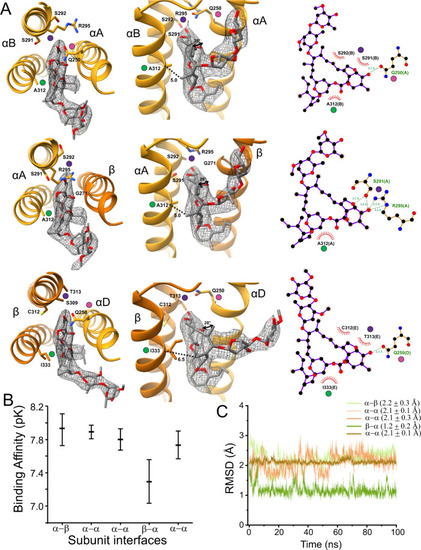
A A select set of ivermectin interactions is shown at different angles and with LigPlot results. Map density is shown at σ = 0.11. The αΒ/αΑ, αΑ/β, and β/αD interface are respectively shown in the top, middle and bottom rows. Colored dots show the same location in different views. The dotted lines show the distance from the Cα carbon at αΑ312 (βΙ333) to the methyl carbon at position 14 of the ivermectin macrocyclic lactone. The curved arrows in the middle panel of α/β show the rotation, relative to αV304 (βV325), of the methyl carbon at position 12 of the ivermectin macrocyclic lactone. For clarity, only the side chains discussed in the manuscript are shown, and the full interaction profile is given in Supplementary Fig. 7. B Binding affinity of ivermectin binding to different subunit interfaces evaluated with the GNINA docking scoring function. The mean and standard deviation are from an ensemble of models as described in ref. 99. C Root mean square deviation (RMSD) of ivermectin at different subunit interfaces during an unrestrained simulation. The RMSD is calculated with respect to the cryo-EM binding pose. |
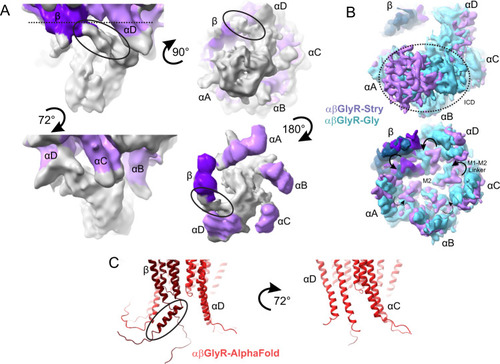
A Partial signal subtraction and local refinement of αβGlyR-Stry particles reveal general features of the ICD. The density is shown at σ = 0.09 at multiple angles. Map density is colored purple near residues modeled in the full αβGlyR-Stry map, with the darker shade corresponding to βGlyR. Density is colored gray for regions not modeled. The black oval shows an asymmetric bend in the density βGlyR. B Bottom view of the full map of αβGlyR-Stry and αβGlyR-Gly. The top image is shown at a low threshold and the bottom at a high threshold (σ = 0.133 and σ = 0.17 for αβGlyR-Stry, σ = 0.23 and σ = 0.33 for and αβGlyR-Gly). The dotted circle shows the ICD density in the low threshold image, and the arrows show M1−M2 loop displacement in the high threshold image. M1−M2 displacement seems less pronounced in subunits near the ICD density. C AlphaFold predictions of the TMD and ICD of the assembled heteromeric channel. The left image shows the interface that matches β/αD and the right shows the interface that matches αD/αC. The black oval shows a break in the post-M3 helix of βGlyR that occurs near the asymmetric density highlighted in panel (A). However, the predicted bend is in the opposite direction of the observed density. |