
FIGURE
Fig. 5
- ID
- ZDB-FIG-230319-32
- Publication
- Gibbs et al., 2023 - Conformational transitions and allosteric modulation in a heteromeric glycine receptor
- Other Figures
- All Figure Page
- Back to All Figure Page
Fig. 5
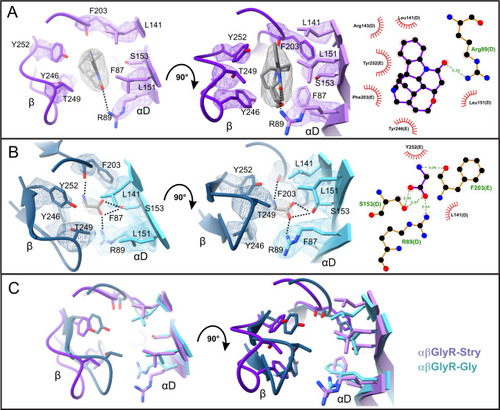
The binding pocket for A strychnine in αβGlyR-Stry and B glycine in αβGlyR-Gly shown at different angles. Map density is shown at σ = 0.3 and σ = 0.55 for strychnine and glycine, respectively. LigPlot analysis is shown on the right. C Overlaid models show structural rearrangements between αβGlyR-Stry and αβGlyR-Gly. Ligands are omitted for clarity. |
Expression Data
Expression Detail
Antibody Labeling
Phenotype Data
Phenotype Detail
Acknowledgments
This image is the copyrighted work of the attributed author or publisher, and
ZFIN has permission only to display this image to its users.
Additional permissions should be obtained from the applicable author or publisher of the image.
Full text @ Nat. Commun.