
Fig. 6
- ID
- ZDB-FIG-230319-33
- Publication
- Gibbs et al., 2023 - Conformational transitions and allosteric modulation in a heteromeric glycine receptor
- Other Figures
- All Figure Page
- Back to All Figure Page
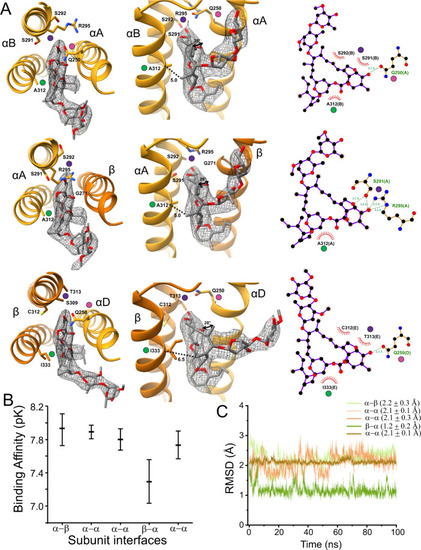
A A select set of ivermectin interactions is shown at different angles and with LigPlot results. Map density is shown at σ = 0.11. The αΒ/αΑ, αΑ/β, and β/αD interface are respectively shown in the top, middle and bottom rows. Colored dots show the same location in different views. The dotted lines show the distance from the Cα carbon at αΑ312 (βΙ333) to the methyl carbon at position 14 of the ivermectin macrocyclic lactone. The curved arrows in the middle panel of α/β show the rotation, relative to αV304 (βV325), of the methyl carbon at position 12 of the ivermectin macrocyclic lactone. For clarity, only the side chains discussed in the manuscript are shown, and the full interaction profile is given in Supplementary Fig. 7. B Binding affinity of ivermectin binding to different subunit interfaces evaluated with the GNINA docking scoring function. The mean and standard deviation are from an ensemble of models as described in ref. 99. C Root mean square deviation (RMSD) of ivermectin at different subunit interfaces during an unrestrained simulation. The RMSD is calculated with respect to the cryo-EM binding pose. |