
Fig. 3
- ID
- ZDB-FIG-230319-30
- Publication
- Gibbs et al., 2023 - Conformational transitions and allosteric modulation in a heteromeric glycine receptor
- Other Figures
- All Figure Page
- Back to All Figure Page
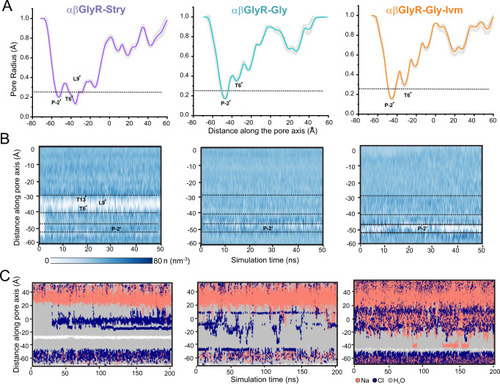
A Mean pore radius profile and standard deviations averaged across 50 ns equilibrium simulations for αβGlyR-Stry (left), αβGlyR-Gly (middle), and αβGlyR-Gly-Ivm (right) along the central pore axis. The one-standard-deviation range is shown as a gray band, and the thick line is the mean of a 50 ns simulation. B Water density within the channel pore. Each discrete water molecule position is associated with a Gaussian distribution, and the sum of all Gaussians yields the density function of water along the channel center line. Bulk water has a density of 33 nm−3. The time series of water density was calculated for 50 ns equilibrium simulations. C Trajectories along the pore axis of water molecules and ion coordinates within 10 Å of the channel axis inside the pore, in the presence of a +500 mV transmembrane potential difference (i.e., with the cytoplasmic side having a positive potential). No chloride permeation was observed past L9′ or P-2′ for αβGlyR-Stry, consistent with a closed channel state. No chloride permeation was observed past P-2′ for αβGlyR-Gly and αβGlyR-Gly-Ivm, consistent with a desensitized channel state. During all simulations, positional restraints were placed on the protein backbone, in order to preserve the experimental conformational state while permitting rotameric flexibility in amino acid side chains. |