
|
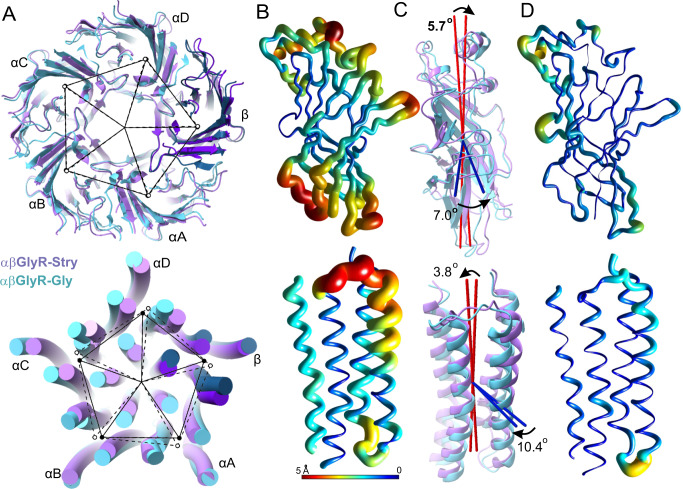
Fig. 4
The ECD and TMD were analyzed separately, with respective results shown in the top and bottom rows. A Image overlay showing subunit displacement. The center of mass of each subunit domain is shown as a closed circle for αβGlyR-Stry and an open circle for αβGlyR-Gly. Exact distances and angles between subunits are given in Supplementary Table 6. B Ribbon diagrams of the αA subunit. Thickness and color show the displacement of the main chain atom between αβGlyR-Stry and αβGlyR-Gly. Results are similar for other subunits. C Images showing the motions described by two of the three principal components. These are associated with subunit tilt (red) and rotation (blue). The measured tilt and rotation are generally consistent between subunits, and exact values for each subunit are given in Supplementary Table 7. D Ribbon diagrams showing atomic displacement after correcting for subunit tilt and rotation. Differences highlight conformational changes that are not well-described by the rigid rotation of the subunit domain.