
Fig. 2
- ID
- ZDB-FIG-230319-29
- Publication
- Gibbs et al., 2023 - Conformational transitions and allosteric modulation in a heteromeric glycine receptor
- Other Figures
- All Figure Page
- Back to All Figure Page
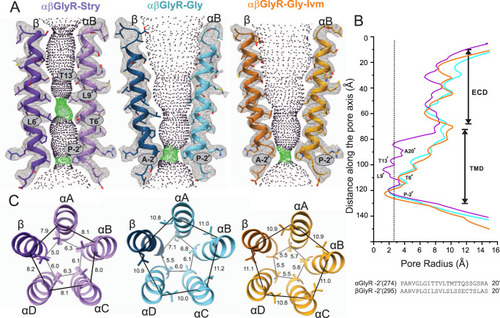
A Map and model representations of M2 helices in the αB and β subunits as seen in αβGly-Stry, αβGly-Gly and αβGly-Gly-Ivm (σ = 0.146, 0.25, and 0.13, respectively). The ion permeation profiles of the channel pore were generated using HOLE85. The side chains lining the constrictions (green dots) are labeled. B The smallest pore radii as a function of the position along the pore axis. The radius of a hydrated chloride ion is indicated as a dotted line and shows that all three states are expected to be non-conducting, though this analysis does not consider hydrophobicity or pore asymmetry. Residues lining the M2 helix for each subunit are shown below the plot. C Top-down views of the L9′ and P-2′ positions which respectively correspond to the channel activation and desensitization gates. Distance labels are in Å. |