
Fig. 1
- ID
- ZDB-FIG-230319-28
- Publication
- Gibbs et al., 2023 - Conformational transitions and allosteric modulation in a heteromeric glycine receptor
- Other Figures
- All Figure Page
- Back to All Figure Page
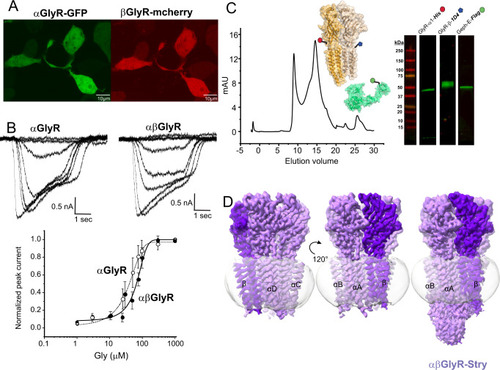
A Confocal fluorescent microscopy images of HEK 293 T cells showing GFP and mCherry expression, which respectively co-expressed with αGlyR and βGlyR subunits, via a bicistronic plasmid. βGlyR was transfected at a 5:1 excess, even though the mCherry fluorescence appears weaker. Generally, transfection efficiency was around 50%, and similar fluorescent images were observed for all cell plates used for electrophysiology. B Whole-cell current recordings from HEK 293 T cells transfected with only αGlyR (left) and with αGlyR and βGlyR (right) in response to glycine (concentration range: 1–1000 μM). Dose–response curves were generated from recordings on different batches of cells. The EC50 for αGlyR was 19 ± 11 μM (n = 5), and for αβGlyR was 63 ± 13 μM (n = 4). Data are presented as mean values ± standard deviation. C αβGlyR (coexpressed with Geph-E) was purified with a two-step affinity purification using subunit-specific affinity tags for βGlyR (1D4) and αGlyR (8xHis) followed by separation using size exclusion chromatography. The main peak (~14.8 ml) was at the elution volume expected for a pentameric assembly, and western blot analysis showed the peak contained all three expressed proteins. Similar gel filtration profiles were consistent for about 20 purifications in the course of this study. D Final cryo-EM reconstructions of αβGlyR-Stry. The density corresponding to the beta subunit is colored in a darker shade of purple. The left and center figures are shown at σ = 0.16, and the rightmost figure is shown at σ = 0.09 to highlight the diffuse ICD signal. |