
Fig. 7
- ID
- ZDB-FIG-230319-34
- Publication
- Gibbs et al., 2023 - Conformational transitions and allosteric modulation in a heteromeric glycine receptor
- Other Figures
- All Figure Page
- Back to All Figure Page
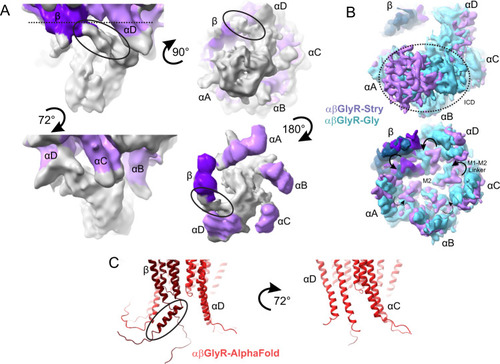
A Partial signal subtraction and local refinement of αβGlyR-Stry particles reveal general features of the ICD. The density is shown at σ = 0.09 at multiple angles. Map density is colored purple near residues modeled in the full αβGlyR-Stry map, with the darker shade corresponding to βGlyR. Density is colored gray for regions not modeled. The black oval shows an asymmetric bend in the density βGlyR. B Bottom view of the full map of αβGlyR-Stry and αβGlyR-Gly. The top image is shown at a low threshold and the bottom at a high threshold (σ = 0.133 and σ = 0.17 for αβGlyR-Stry, σ = 0.23 and σ = 0.33 for and αβGlyR-Gly). The dotted circle shows the ICD density in the low threshold image, and the arrows show M1−M2 loop displacement in the high threshold image. M1−M2 displacement seems less pronounced in subunits near the ICD density. C AlphaFold predictions of the TMD and ICD of the assembled heteromeric channel. The left image shows the interface that matches β/αD and the right shows the interface that matches αD/αC. The black oval shows a break in the post-M3 helix of βGlyR that occurs near the asymmetric density highlighted in panel (A). However, the predicted bend is in the opposite direction of the observed density. |