
- Title
-
Single-cell sequencing reveals the evolution of immune molecules across multiple vertebrate species
- Authors
- Jiao, A., Zhang, C., Wang, X., Sun, L., Liu, H., Su, Y., Lei, L., Li, W., Ding, R., Ding, C., Dou, M., Tian, P., Sun, C., Yang, X., Zhang, L., Zhang, B.
- Source
- Full text @ J Adv Res
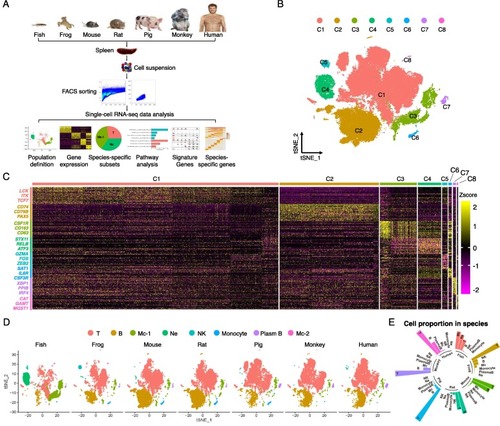
Immune cell composition in the spleen across species by scRNA-seq analysis. (A) Flow scheme of the scRNA-seq experiment design and analyses. (B) Clusters of 80,315 cells (all species) in t-SNE space, colors coded by clusters. (C) The heatmap of marker genes in each cluster with important ones labeled on the left. The color bar shows the expression level normalized by the z-score method. (D) The cell clusters (t-SNE plots) and the composition of immune cells in each species. (E) The fraction of major immune cell types in all cells for each species, color coded by species. Mc, Macrophage; Ne, Neutrophil. |
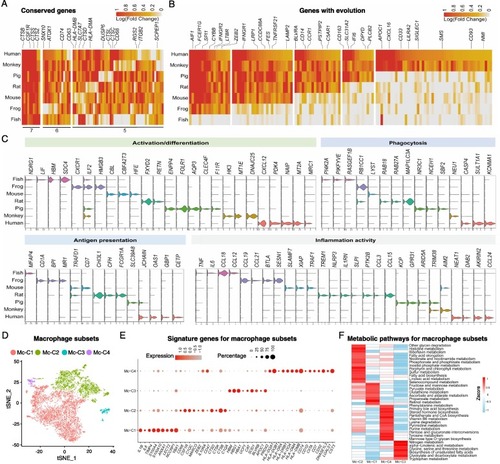
Macrophages of different species showed great variation. (A, B) Function-related genes in macrophages with conservation (A) and genes emerged expression along with the evolution of species (B) were shown. The numbers in Figure A represent the number of species. (C) Violin plots showing the expression of signature genes related to macrophage activation/differentiation, phagocytosis, antigen presentation and inflammation activity. (D) Composition of macrophage subsets in t-SNE space in each species, color coded by subsets. (E) The expression of marker genes of each macrophage subsets with dot color signifying the relative expression and dot size scaled by the fraction of cells expressing the gene. (F) The heatmap showing the metabolic pathways enriched in each macrophage subsets. The color bar shows the expression level normalized by the z-score method. |
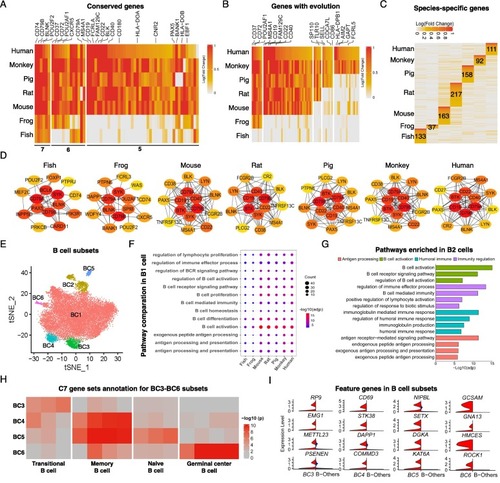
Characterization of B cells in spleens from different species. (A, B) Function-related genes in B cells with conservation (A) and genes emerged expression along with the evolution of species (B) were shown. The numbers represent the number of species. (C) Heatmap of up-regulated genes that are species-specific in B cells with number labeled. The color indicates the log-scaled fold change of each gene. The numbers represent the number of genes specific to each species. (D) PPI of each species using the top 15 highly expressed genes in B cells. The color represents the degree of association with other genes. (E) The subsets of B cells in t-SNE space in each species, color coded by subsets. (F) B cell functional pathways enriched in each species using up-regulated genes in BC1 comparing to other B cells. The dot color indicates the significance and the dot size is scaled by the number of up-regulated genes in the pathway. (G) Pathways enriched using up-regulated genes in BC2 comparing to other B cells, color coded by the pathway types. (H) C7 gene sets annotation of up-regulated B cell genes in BC3, BC4, BC5 and BC6, color indicates the significance. (I) Feature genes expressed in BC3, BC4, BC5 and BC6 (red) comparing to other cells (blue). (For interpretation of the references to color in this figure legend, the reader is referred to the web version of this article.) |

The characteristics of T cells in evolution. (A) Subsets of T cells in t-SNE space, expression of marker genes and the cell types assigned to each subset were shown from left to right. (B, C) Key genes in TCR signaling pathway conservatively (B) or specifically (C) expressed in different species. The color gradient denotes the level of gene expression, red being high whereas gray being low. (D) Differential usage of TCR signaling cascades were summarized in each species. Components expressed in the species were shown in color while no/low expressed ones were in gray. (E, F) The expression of T cell migration-related genes (E) and T cell homeostasis-related genes (F). The dot color indicates the relative gene expression and the dot size is scaled by the percentage of T cells expressing the gene. (For interpretation of the references to color in this figure legend, the reader is referred to the web version of this article.) |
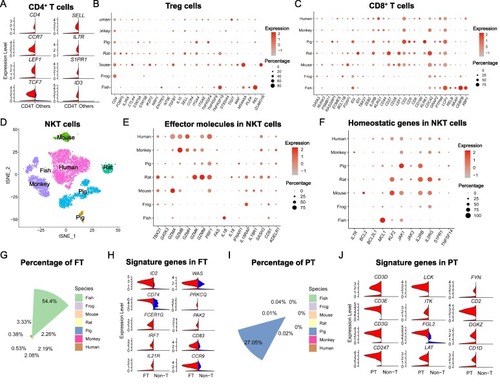
Characterization of immune functions in T cell subsets across species. (A) Up-regulated genes of CD4 T cells (red) compared to other T cells (blue). (B) Dot lot showing the expression of functional genes in Treg cells from different species, in which the dot color indicates the relative gene expression and the dot size is scaled by the percentage of Treg cells expressing the gene. (C) Expression of vital genes associated with CD8+ T cell functions such as activation across species. (D) The fraction of NKT cells in all T cells in each species, color coded by different species. (E, F) Expression of genes related to the effector molecules (E) or homeostasis (F) of NKT cells across species. (G) The fraction of zebrafish-specific T cells (FT) in total T cells in each species, color coded by different species. (H) The expression of innate lymphocyte markers (left chart) and T cell markers (right chart) in FT cells (red) comparing to the non-T cells (blue). (I) The fraction of pig-specific T cells (PT) in all T cells in each species, color coded by different species. (J) Expression of T cell function-related genes in PT cells (red) comparing to the non-T cells (blue). (For interpretation of the references to color in this figure legend, the reader is referred to the web version of this article.) |
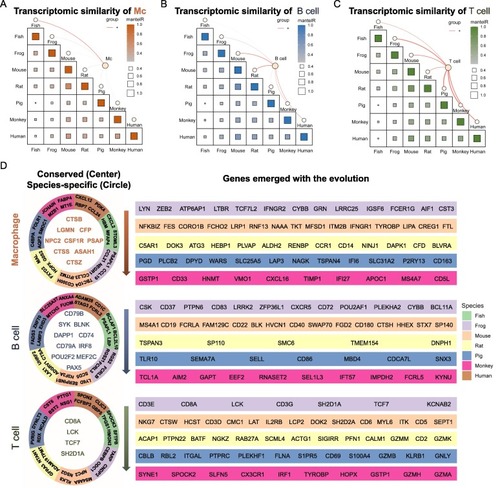
Inter-species comparison identifies core gene program across evolutionarily species. (A-C) Inter-species comparison of all expressed genes shows the transcriptomic similarities of macrophages (A), B cells (B) and T cells (C) between different species. The size of the square indicates gene number and the color indicates the degree of similarities. The orange lines represent the cell types in each species and the thickness indicates the cell proportion. (D) Functional genes conserved in all species, with species-specificity and emerged along with the evolution of species were shown for macrophages, B cells and T cells. The conserved genes among all species were marked in the left center with colors showing each cell types. Species-specific genes were located at the left second circle with colors showing each species. Genes emerged with the evolution were marked in the right stripes from xenopus to rhesus macaque. (For interpretation of the references to color in this figure legend, the reader is referred to the web version of this article.) |