
Fig. 6
- ID
- ZDB-FIG-240313-14
- Publication
- Jiao et al., 2023 - Single-cell sequencing reveals the evolution of immune molecules across multiple vertebrate species
- Other Figures
- All Figure Page
- Back to All Figure Page
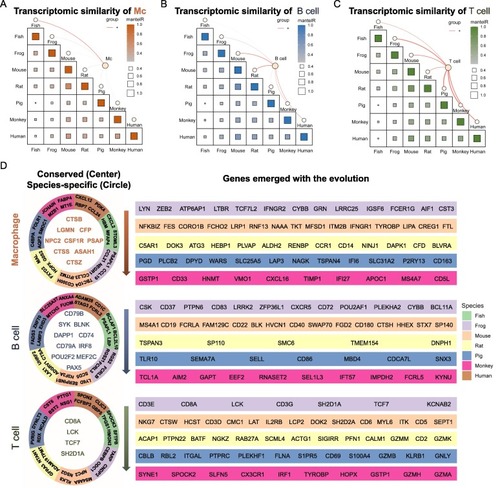
Inter-species comparison identifies core gene program across evolutionarily species. (A-C) Inter-species comparison of all expressed genes shows the transcriptomic similarities of macrophages (A), B cells (B) and T cells (C) between different species. The size of the square indicates gene number and the color indicates the degree of similarities. The orange lines represent the cell types in each species and the thickness indicates the cell proportion. (D) Functional genes conserved in all species, with species-specificity and emerged along with the evolution of species were shown for macrophages, B cells and T cells. The conserved genes among all species were marked in the left center with colors showing each cell types. Species-specific genes were located at the left second circle with colors showing each species. Genes emerged with the evolution were marked in the right stripes from xenopus to rhesus macaque. (For interpretation of the references to color in this figure legend, the reader is referred to the web version of this article.) |