
|
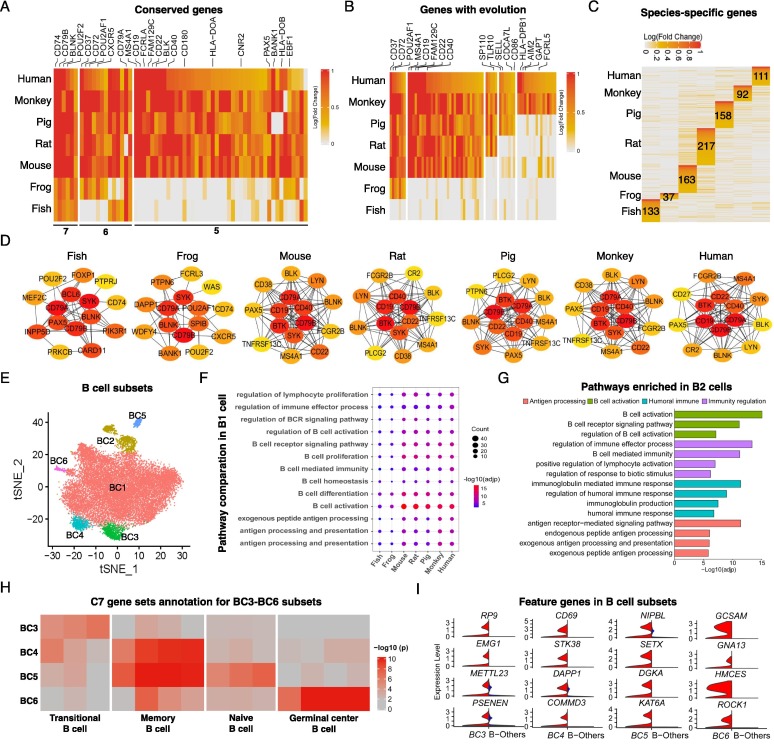
Fig. 3 Characterization of B cells in spleens from different species. (A, B) Function-related genes in B cells with conservation (A) and genes emerged expression along with the evolution of species (B) were shown. The numbers represent the number of species. (C) Heatmap of up-regulated genes that are species-specific in B cells with number labeled. The color indicates the log-scaled fold change of each gene. The numbers represent the number of genes specific to each species. (D) PPI of each species using the top 15 highly expressed genes in B cells. The color represents the degree of association with other genes. (E) The subsets of B cells in t-SNE space in each species, color coded by subsets. (F) B cell functional pathways enriched in each species using up-regulated genes in BC1 comparing to other B cells. The dot color indicates the significance and the dot size is scaled by the number of up-regulated genes in the pathway. (G) Pathways enriched using up-regulated genes in BC2 comparing to other B cells, color coded by the pathway types. (H) C7 gene sets annotation of up-regulated B cell genes in BC3, BC4, BC5 and BC6, color indicates the significance. (I) Feature genes expressed in BC3, BC4, BC5 and BC6 (red) comparing to other cells (blue). (For interpretation of the references to color in this figure legend, the reader is referred to the web version of this article.)