
Fig. 1
- ID
- ZDB-FIG-240313-9
- Publication
- Jiao et al., 2023 - Single-cell sequencing reveals the evolution of immune molecules across multiple vertebrate species
- Other Figures
- All Figure Page
- Back to All Figure Page
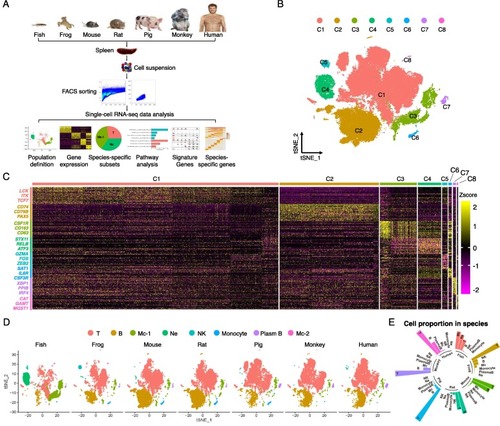
Immune cell composition in the spleen across species by scRNA-seq analysis. (A) Flow scheme of the scRNA-seq experiment design and analyses. (B) Clusters of 80,315 cells (all species) in t-SNE space, colors coded by clusters. (C) The heatmap of marker genes in each cluster with important ones labeled on the left. The color bar shows the expression level normalized by the z-score method. (D) The cell clusters (t-SNE plots) and the composition of immune cells in each species. (E) The fraction of major immune cell types in all cells for each species, color coded by species. Mc, Macrophage; Ne, Neutrophil. |