
Fig. 5
- ID
- ZDB-FIG-240313-13
- Publication
- Jiao et al., 2023 - Single-cell sequencing reveals the evolution of immune molecules across multiple vertebrate species
- Other Figures
- All Figure Page
- Back to All Figure Page
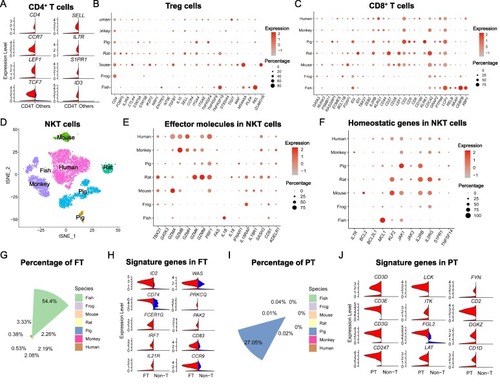
Characterization of immune functions in T cell subsets across species. (A) Up-regulated genes of CD4 T cells (red) compared to other T cells (blue). (B) Dot lot showing the expression of functional genes in Treg cells from different species, in which the dot color indicates the relative gene expression and the dot size is scaled by the percentage of Treg cells expressing the gene. (C) Expression of vital genes associated with CD8+ T cell functions such as activation across species. (D) The fraction of NKT cells in all T cells in each species, color coded by different species. (E, F) Expression of genes related to the effector molecules (E) or homeostasis (F) of NKT cells across species. (G) The fraction of zebrafish-specific T cells (FT) in total T cells in each species, color coded by different species. (H) The expression of innate lymphocyte markers (left chart) and T cell markers (right chart) in FT cells (red) comparing to the non-T cells (blue). (I) The fraction of pig-specific T cells (PT) in all T cells in each species, color coded by different species. (J) Expression of T cell function-related genes in PT cells (red) comparing to the non-T cells (blue). (For interpretation of the references to color in this figure legend, the reader is referred to the web version of this article.) |