
Fig. 2
- ID
- ZDB-FIG-240313-10
- Publication
- Jiao et al., 2023 - Single-cell sequencing reveals the evolution of immune molecules across multiple vertebrate species
- Other Figures
- All Figure Page
- Back to All Figure Page
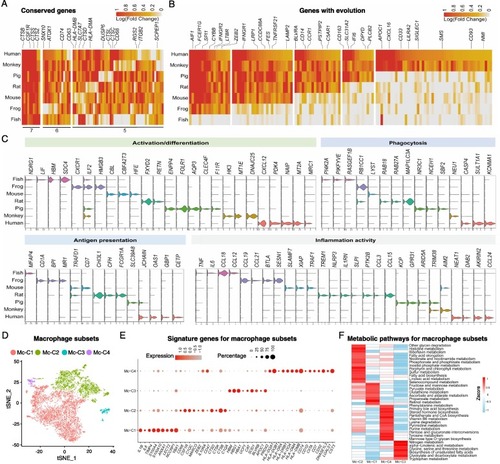
Macrophages of different species showed great variation. (A, B) Function-related genes in macrophages with conservation (A) and genes emerged expression along with the evolution of species (B) were shown. The numbers in Figure A represent the number of species. (C) Violin plots showing the expression of signature genes related to macrophage activation/differentiation, phagocytosis, antigen presentation and inflammation activity. (D) Composition of macrophage subsets in t-SNE space in each species, color coded by subsets. (E) The expression of marker genes of each macrophage subsets with dot color signifying the relative expression and dot size scaled by the fraction of cells expressing the gene. (F) The heatmap showing the metabolic pathways enriched in each macrophage subsets. The color bar shows the expression level normalized by the z-score method. |