
- Title
-
Dietary Application of the Microalga Lobosphaera incisa P127 Reduces Severity of Intestinal Inflammation, Modulates Gut-Associated Gene Expression and Microbiome in the Zebrafish Model of IBD
- Authors
- Novichkova, E., Nayak, S., Boussiba, S., Gopas, J., Zilberg, D., Khozin-Goldberg, I.
- Source
- Full text @ Mol. Nutr. Food Res.
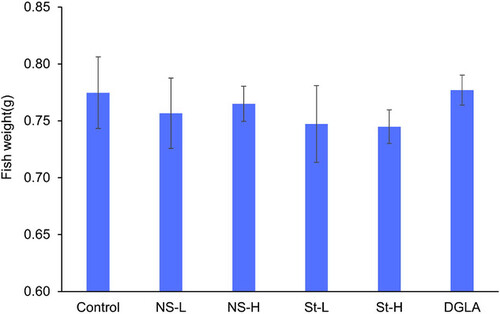
Dietary manipulations did not affect zebrafish weight gain. Zebrafish weight after 28 days of feeding with experimental diets (n = 30 in four replicate aquaria); bars indicate standard deviation. Ns-L, 7.5% of non-starved L. incisa P127 biomass; Ns-H, 15% of non-starved L. incisa P127 biomass; St-L, 7.5% of N-starved L. incisa P127 biomass, Ns-H, 15% of N-starved biomass; DGLA, commercial DGLA ethyl ester.
|
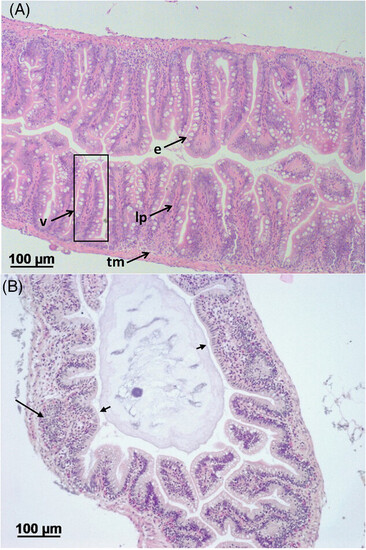
Administration of TNBS resulted in pathological alterations in the intestine. A) Normal structure of intact zebrafish intestine. V, villus; e, epithelium with goblet cells; lp, lamina propria; tm, tunica muscularis. B) Gut tissue histopathology in TNBS-challenged zebrafish at 24 h post-TNBS intubation. Long arrows point at infiltration of leucocytes into intestinal villi; short arrows point at enlarged villus. H&E staining.
|
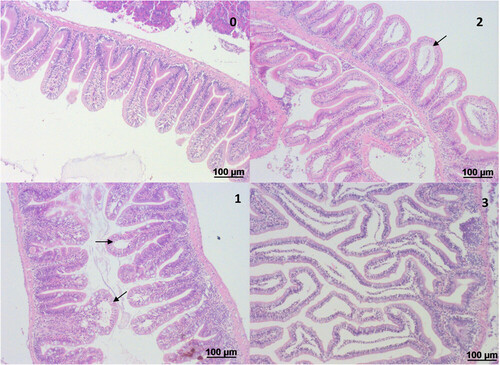
Hindgut of adult zebrafish following challenge with 120 mM TNBS, applied by anal intubation. The gut was analyzed 24 h after TNBS intubation for pathological alterations. The most prominent and consistent alteration was epithelial detachment (shown with arrow), which was graded to the degree of severity. The grade is noted on the top right of each image as follows: Level 0: gut of naïve zebrafish; Level 1: epithelial detachment is restricted to the top of the villus and accounts for 15–20% of the epithelium; Level 2: epithelial detachment involves about half of the villi and accounts for 50% of the epithelium; Level 3: epithelial detachment involves the whole length of the villus and accounts for 90–95% of the epithelium. H&E staining.
|
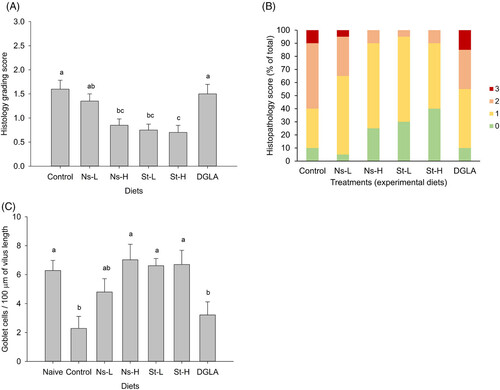
Grading of intestinal histopathological alterations. A) Average score of gut epithelial detachment for the different treatment groups. B) Distribution of the different gut histopathology grades within treatment groups. C) Number of goblet cells per villus length in the different treatment groups (n = 20 fish per treatment; total of 10 villi per fish were analyzed). Abbreviations of treatment groups: Ns-L, 7.5% of non-starved L. incisa P127 biomass; Ns-H, 15% of non-starved L. incisa P127 biomass; St-L, 7.5% of N-starved L. incisa P127 biomass; Ns-H, 15% of N-starved biomass; DGLA, commercial DGLA ethyl ester (n = 20 analyzed fish per treatment).
|
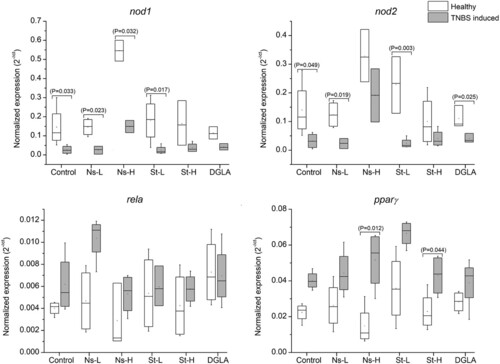
Expression of nod1 and nod2, pparγ, and rela (p65 subunit of NFkB) genes in the guts of zebrafish fed with the different experimental diets. Abbreviations: Control refers to the non-supplemented TNBS-challenged group; Ns-L, 7.5% of non-starved L. incisa P127 biomass; Ns-H, 15% of non-starved L. incisa P127 biomass; St-L, 7.5% of N-starved L. incisa P127 biomass; Ns-H, 15% of N-starved biomass; DGLA, commercial DGLA ethyl ester. Values in box plots show relative gene expression levels normalized to the geomean of three housekeeping genes. n = 4 replicates; each replicate is a pool of five fish from a single replicate aquarium. Asterisks denote significant differences as compared to the control, as follows: * before induction (healthy); ** 24 h after TNBS application. Significant differences within treatment group of healthy (before challenge) and TNBS-challenged fish are indicated by a bar, with the p value in brackets.
|
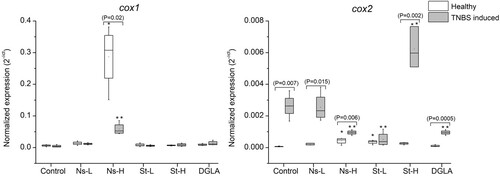
Expression of cox1 and cox2 genes in the guts of zebrafish fed with the different experimental diets. Abbreviations: Control refers to the non-supplemented TNBS-challenged group; Ns-L, 7.5% of non-starved L. incisa P127 biomass; Ns-H, 15% of non-starved L. incisa P127 biomass; St-L: 7.5% of N-starved L. incisa P127 biomass; Ns-H, 15% of N-starved biomass; DGLA, commercial DGLA ethyl ester. Values in box plots show relative gene expression levels normalized to the geomean of three housekeeping genes. n = 4 replicates; each replicate is a pool of five fish from a single replicate aquarium. Asterisks denote significant differences as compared to the control, as follows: * before challenge (healthy); ** after TNBS challenge. Significant differences within treatment groups of healthy (before challenge) and TNBS-challenged fish are indicated by a bar, with the p value in brackets.
|
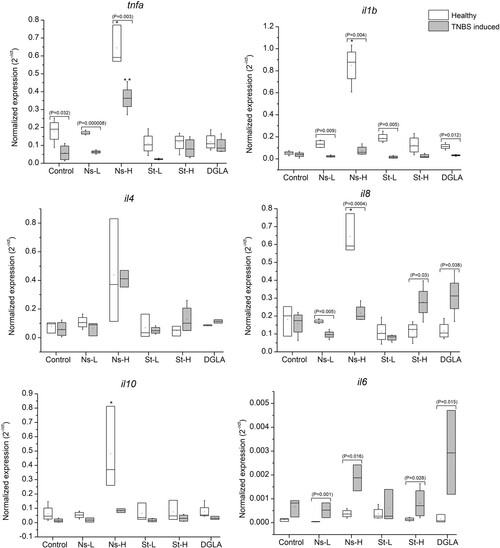
Expression of cytokine genes, tnfα, il1β, il8, il4, il6, and il10, in zebrafish guts. Abbreviations: Control refers to the non-supplemented TNBS-challenged group; Ns-L, 7.5% of non-starved L. incisa P127 biomass; Ns-H, 15% of non-starved L. incisa P127 biomass; St-L, 7.5% of N-starved L. incisa P127 biomass; Ns-H, 15% of N-starved biomass; DGLA, commercial DGLA ethyl ester. Values in box plots show relative gene expression levels normalized to the geomean of three housekeeping genes. n = 4 replicates; each replicate is a pool of five fish from a single replicate aquarium. Asterisks denote significant differences as compared to the control, as follows: * before challenge (healthy); ** after TNBS challenge. Significant differences within treatment groups of healthy (before challenge) and TNBS-challenged fish are indicated by a bar, with the p value in brackets.
|
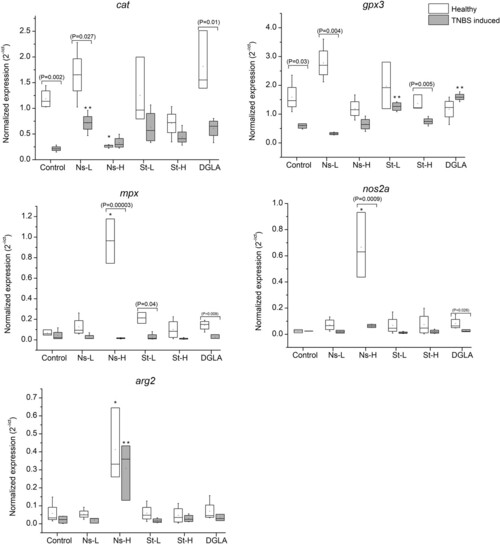
Expression of cat, gpx3 mpx, nos2, and arg2 genes in zebrafish guts. Abbreviations: Control refers to the non-supplemented TNBS-challenged group; Ns-L, 7.5% of non-starved L. incisa P127 biomass; Ns-H, 15% of non-starved L. incisa P127 biomass; St-L, 7.5% of N-starved L. incisa P127 biomass; Ns-H, 15% of N-starved biomass; DGLA, commercial DGLA ethyl ester. Values in box plots show relative gene expression levels normalized to the geomean of three housekeeping genes. n = 4 replicates; each replicate is a pool of five fish from a single replicate aquarium. Asterisks denote significant differences as compared to the control, as follows: * before challenge (healthy); ** after TNBS challenge. Significant differences within treatment groups of healthy (before challenge) and TNBS-challenged fish are indicated by a bar, with the p value in brackets.
|
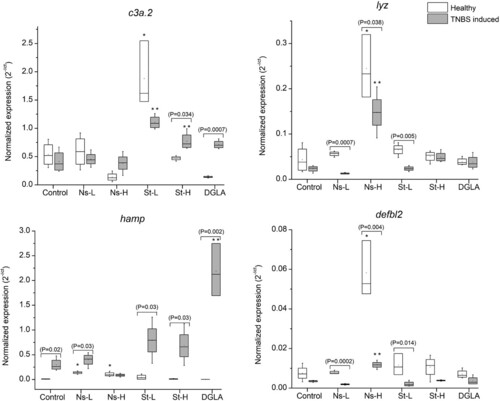
Expression of complement C3, lysozyme, hepcidin, and beta-defensin in zebrafish guts. Abbreviations: Control refers to the non-supplemented TNBS-challenged group; Ns-L, 7.5% of non-starved L. incisa P127 biomass; Ns-H, 15% of non-starved L. incisa P127 biomass; St-L, 7.5% of N-starved L. incisa P127 biomass; Ns-H, 15% of N-starved biomass; DGLA, commercial DGLA ethyl ester. Values in box plots show relative gene expression levels normalized to the geomean of three housekeeping genes. n = 4 replicates; each replicate is a pool of five fish from a single replicate aquarium. Asterisks denote significant differences as compared to the control, as follows: * before challenge (healthy); ** after TNBS challenge. Significant differences within treatment groups of healthy (before challenge) and TNBS-challenged fish are indicated by a bar, with the p value in brackets.
|
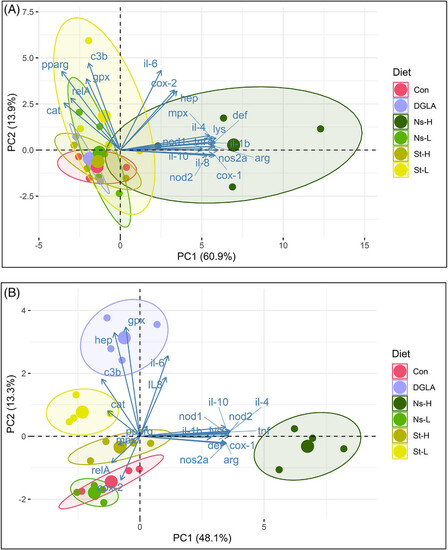
Principal component analysis biplot of gene expression before A) and after the TNBS administration B). Abbreviations: Control refers to the non-supplemented TNBS-challenged group; Ns-L, 7.5% of non-starved L. incisa P127 biomass; Ns-H, 15% of non-starved L. incisa P127 biomass; St-L, 7.5% of N-starved L. incisa P127 biomass; Ns-H, 15% of N-starved biomass; DGLA, commercial DGLA ethyl ester. PCA shows clustering of gene expression profiles by treatment. Samples (biological replicates) from different treatment groups are shown as color points, and different genes are shown as arrows with corresponding gene labels. The distance between points approximates the differences in expression patterns between treatment groups. Arrows close to a sample group are expressed at high abundance/levels in those samples.
|
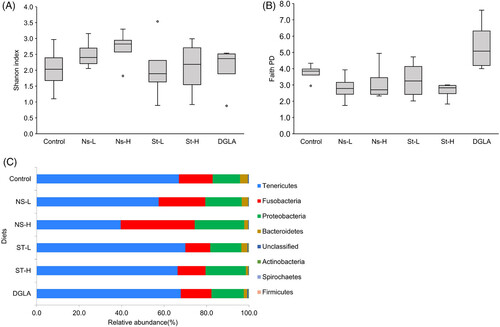
Average microbial alpha diversity indices of A) the Shannon index and B) Faith's phylogenetic diversity for fish fed with different diets (control, Ns-L, Ns-H, St-L, St-H, and DGLA). For each box plot, n = 4 (each experimental replicate is a composite of gut samples from four fish). Control, non-supplemented commercial diet; Ns, diet supplemented with non-starved L. incisa P127; St, diet supplemented with N-starved L. incisa; DGLA, diet, supplemented with commercial DGLA. C) Relative abundance of top eight bacterial phyla in the guts of zebrafish fed with different diets. Individual phyla are indicated in different colors. Values show average relative abundance (%) after taxonomic assignment of bacterial 16S rRNA gene sequences.
|
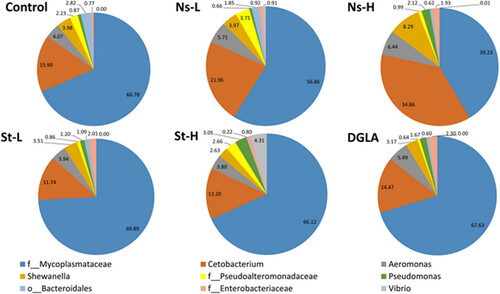
Relative abundance of bacteria at the genus level. The values for the average relative abundance (%) of only the dominant genus obtained after the taxonomic assignment of bacterial 16S rRNA gene sequences are shown. |