
Image
|
Figure Caption
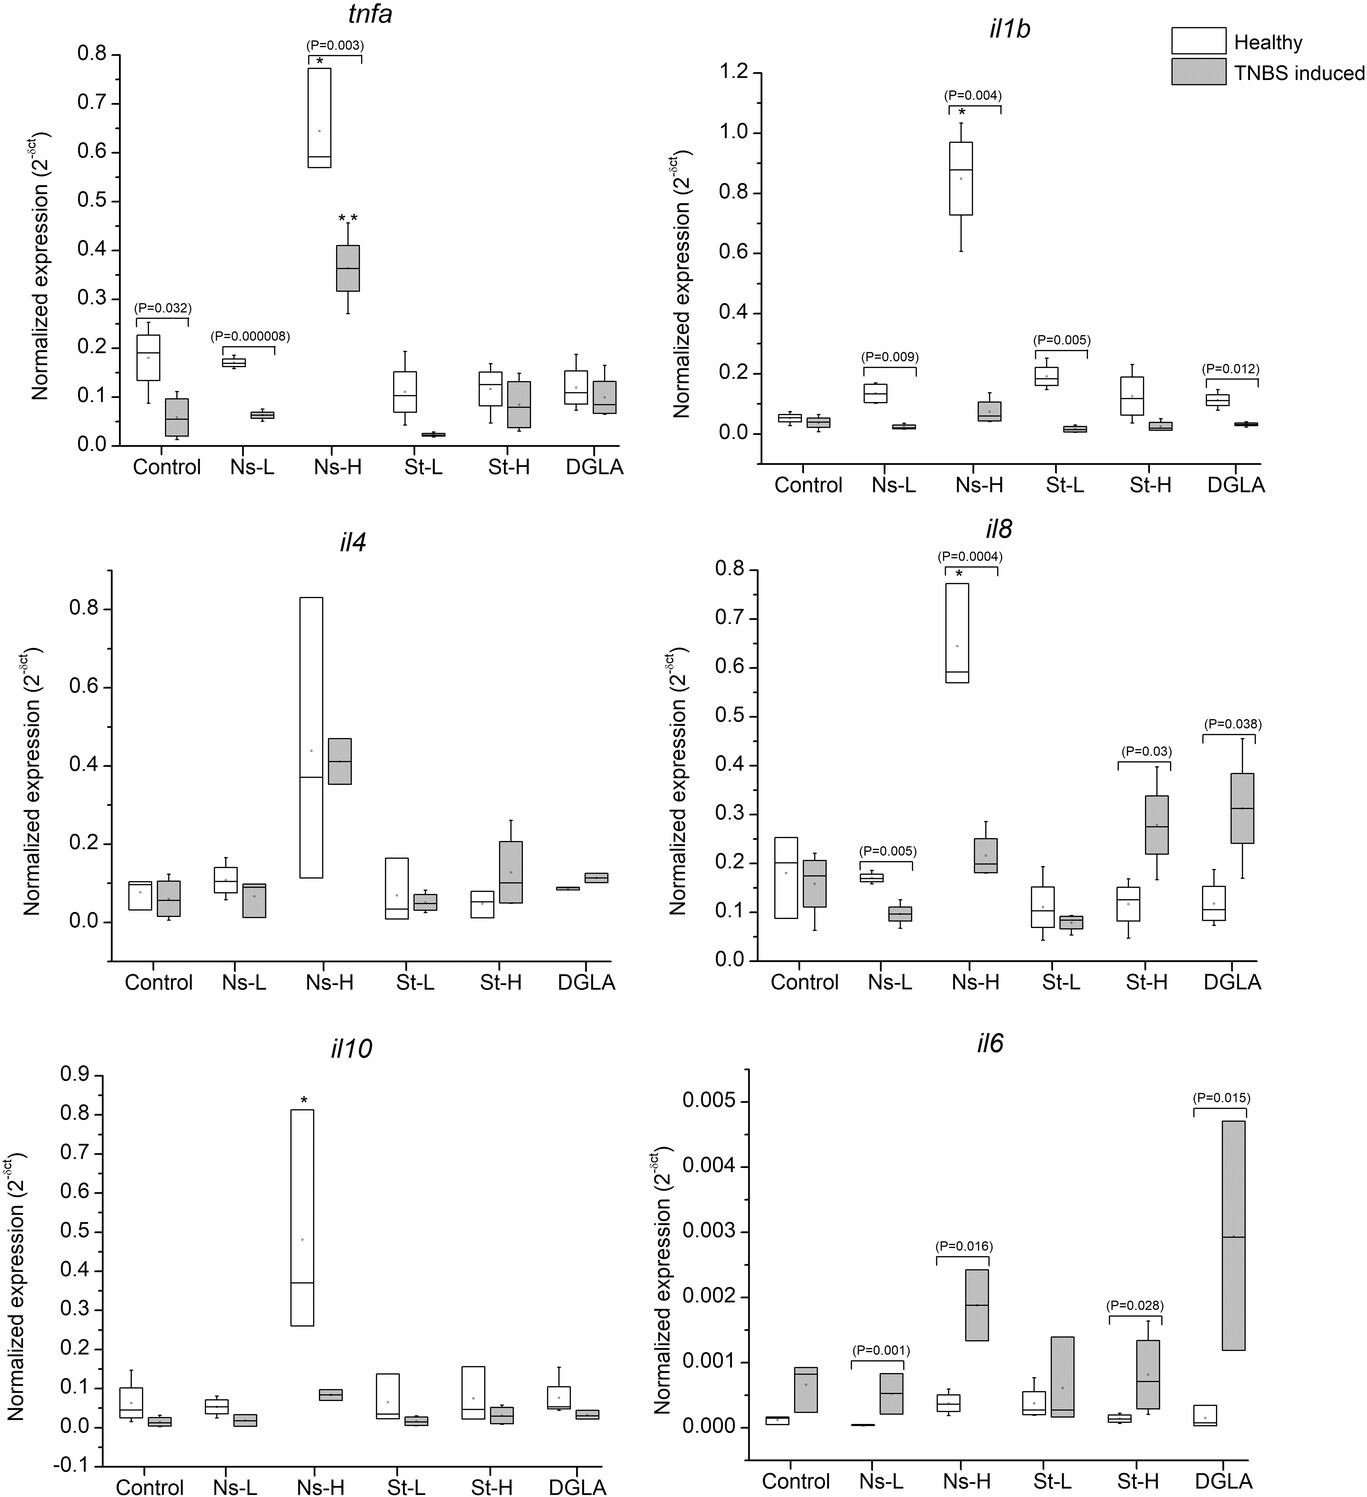
Fig. 7
Expression of cytokine genes, tnfα, il1β, il8, il4, il6, and il10, in zebrafish guts. Abbreviations: Control refers to the non-supplemented TNBS-challenged group; Ns-L, 7.5% of non-starved L. incisa P127 biomass; Ns-H, 15% of non-starved L. incisa P127 biomass; St-L, 7.5% of N-starved L. incisa P127 biomass; Ns-H, 15% of N-starved biomass; DGLA, commercial DGLA ethyl ester. Values in box plots show relative gene expression levels normalized to the geomean of three housekeeping genes. n = 4 replicates; each replicate is a pool of five fish from a single replicate aquarium. Asterisks denote significant differences as compared to the control, as follows: * before challenge (healthy); ** after TNBS challenge. Significant differences within treatment groups of healthy (before challenge) and TNBS-challenged fish are indicated by a bar, with the p value in brackets.
Acknowledgments
This image is the copyrighted work of the attributed author or publisher, and
ZFIN has permission only to display this image to its users.
Additional permissions should be obtained from the applicable author or publisher of the image.
Full text @ Mol. Nutr. Food Res.