
Image
|
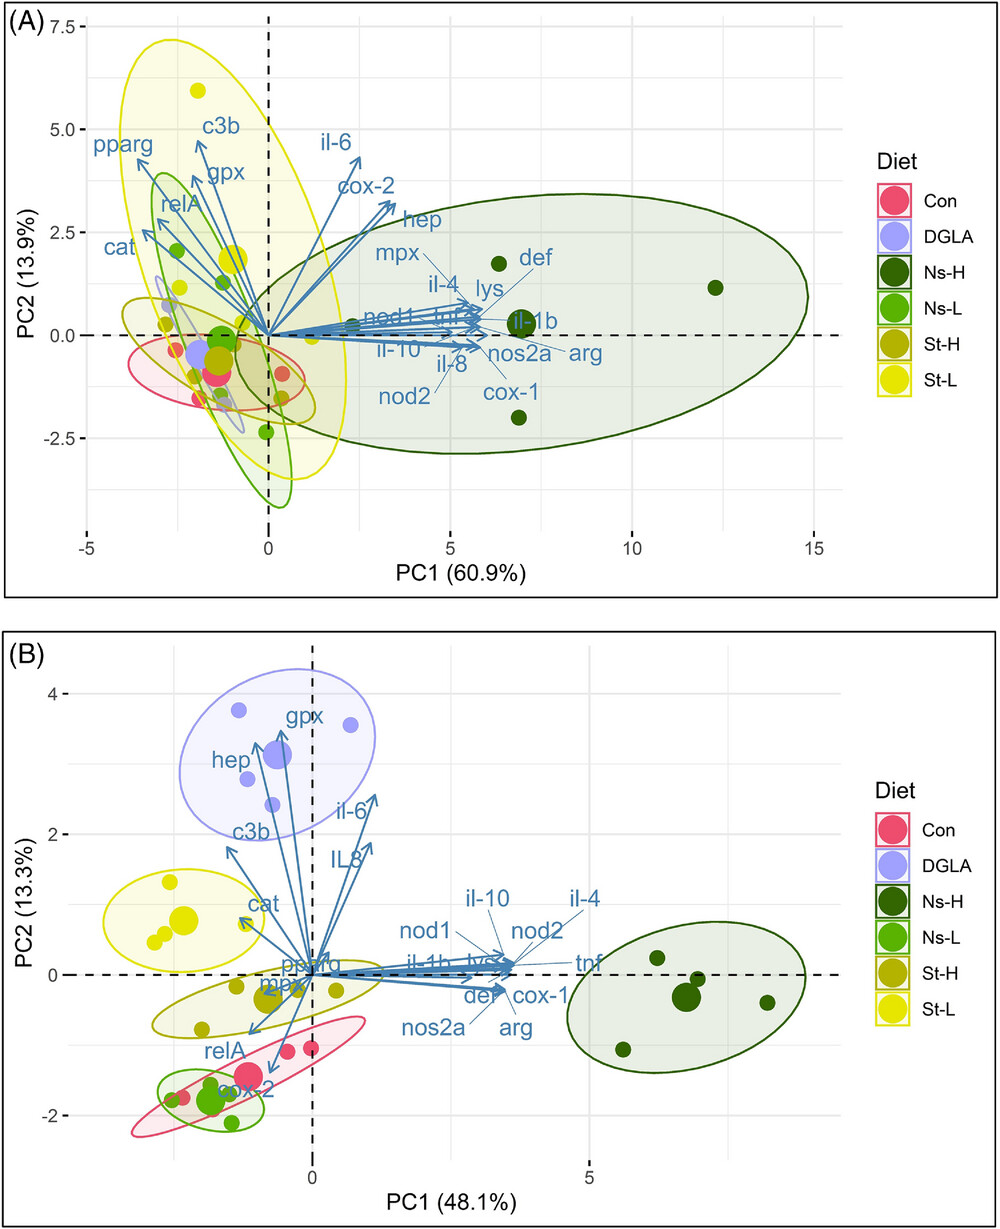
Figure Caption
Fig. 10
Principal component analysis biplot of gene expression before A) and after the TNBS administration B). Abbreviations: Control refers to the non-supplemented TNBS-challenged group; Ns-L, 7.5% of non-starved L. incisa P127 biomass; Ns-H, 15% of non-starved L. incisa P127 biomass; St-L, 7.5% of N-starved L. incisa P127 biomass; Ns-H, 15% of N-starved biomass; DGLA, commercial DGLA ethyl ester. PCA shows clustering of gene expression profiles by treatment. Samples (biological replicates) from different treatment groups are shown as color points, and different genes are shown as arrows with corresponding gene labels. The distance between points approximates the differences in expression patterns between treatment groups. Arrows close to a sample group are expressed at high abundance/levels in those samples.
Acknowledgments
This image is the copyrighted work of the attributed author or publisher, and
ZFIN has permission only to display this image to its users.
Additional permissions should be obtained from the applicable author or publisher of the image.
Full text @ Mol. Nutr. Food Res.