
Image
|
Figure Caption
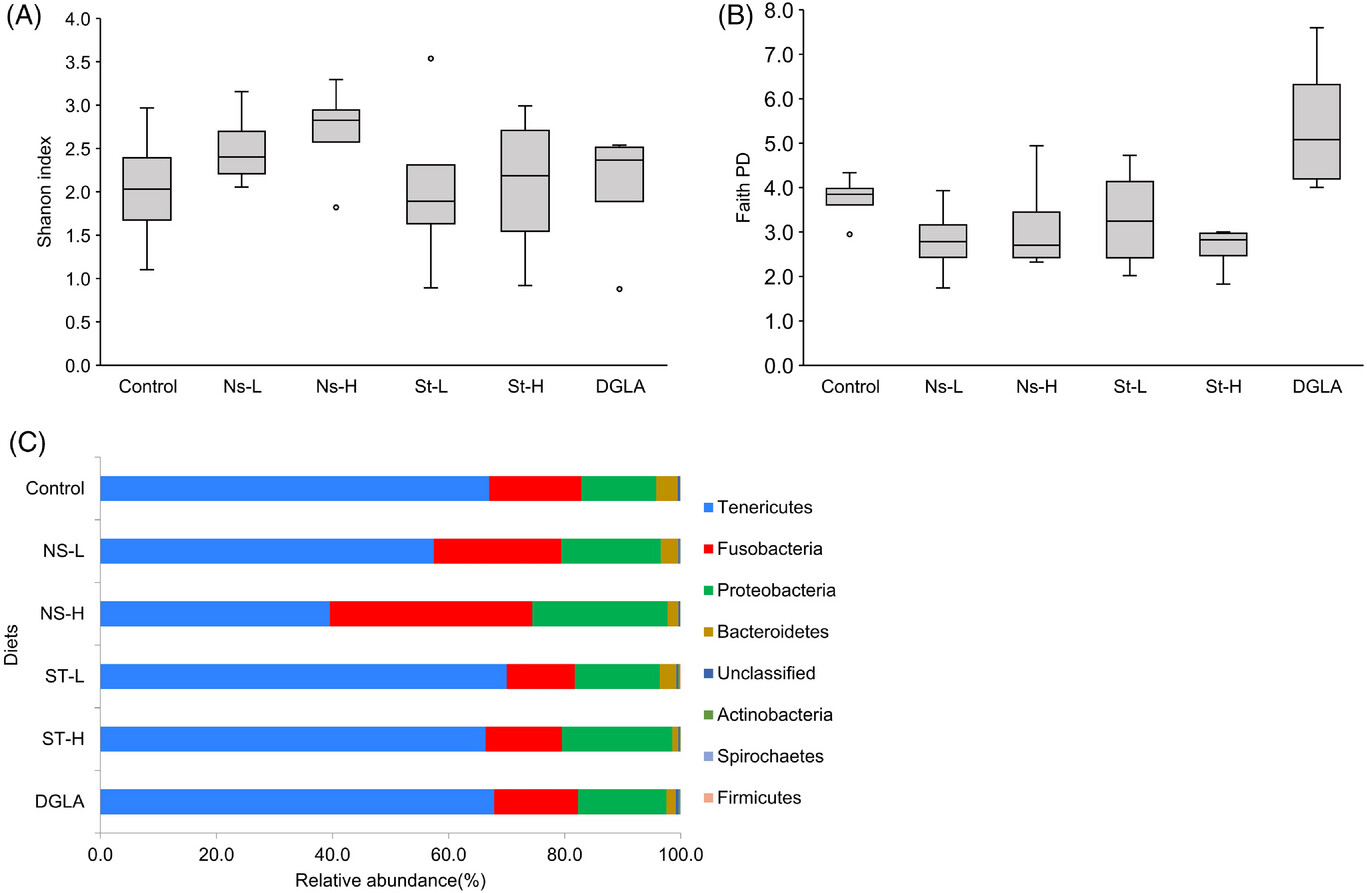
Fig. 11
Average microbial alpha diversity indices of A) the Shannon index and B) Faith's phylogenetic diversity for fish fed with different diets (control, Ns-L, Ns-H, St-L, St-H, and DGLA). For each box plot, n = 4 (each experimental replicate is a composite of gut samples from four fish). Control, non-supplemented commercial diet; Ns, diet supplemented with non-starved L. incisa P127; St, diet supplemented with N-starved L. incisa; DGLA, diet, supplemented with commercial DGLA. C) Relative abundance of top eight bacterial phyla in the guts of zebrafish fed with different diets. Individual phyla are indicated in different colors. Values show average relative abundance (%) after taxonomic assignment of bacterial 16S rRNA gene sequences.
Acknowledgments
This image is the copyrighted work of the attributed author or publisher, and
ZFIN has permission only to display this image to its users.
Additional permissions should be obtained from the applicable author or publisher of the image.
Full text @ Mol. Nutr. Food Res.