
- Title
-
Bacillus licheniformis FA6 Affects Zebrafish Lipid Metabolism through Promoting Acetyl-CoA Synthesis and Inhibiting β-Oxidation
- Authors
- Chen, S., Ye, W., Clements, K.D., Zan, Z., Zhao, W., Zou, H., Wang, G., Wu, S.
- Source
- Full text @ Int. J. Mol. Sci.
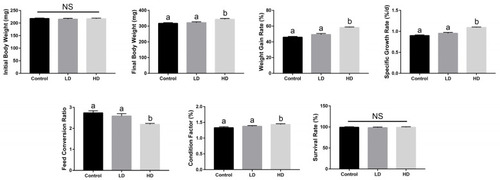
Effects of dietary Bacillus licheniformis FA6 on the growth performance of zebrafish. Data are presented as mean ± SD for three replicate groups, with 40 fish in each group. The means of different superscripts in the same row are significantly different. Different letters above the bars indicate significant differences at the 0.05 level (ANOVA and Duncan’s multiple range test), n = 3. “NS” indicates not significant (p > 0.05). |
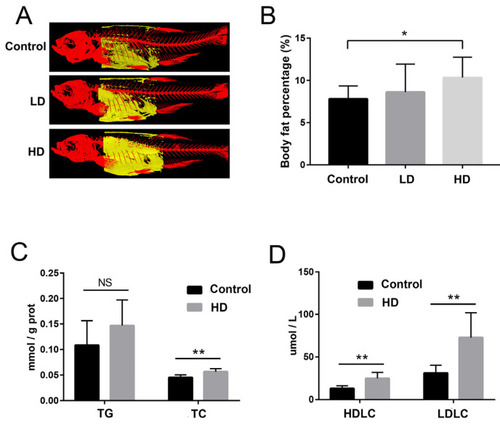
The reconstructed image of body fat revealed by 3D micro-CT, and comparative evaluation of biochemical indexes in zebrafish. (A) Typical images of trunk fat (yellow) of fish in each group based on micro-CT. (B) Percentage of body fat in each group. (C) Bar graph of total triglyceride (TG) and total cholesterol (TC) content in the liver of the control and HD groups. (D) Bar graphs of high-density lipoprotein cholesterol (HDLC) and low-density lipoprotein cholesterol (LDLC) levels in the liver of the control and HD groups. * p-value < 0.05 compared with the control group. ** p-value < 0.01 compared with the control group. “NS” indicates not significant (p > 0.05). |
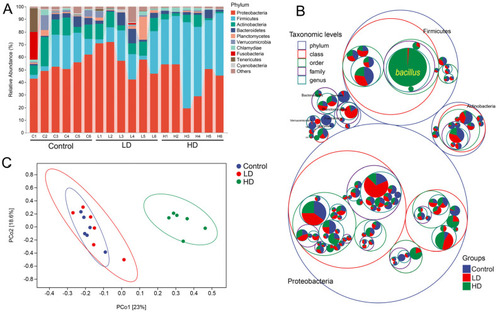
The zebrafish gut microbiota community in the three experimental groups. (A) Composition of microbiota communities in the three groups at phylum level. Each bar represents the community of a sample. Only phyla with a mean relative abundance > 1% are shown; low abundance phyla were assigned to ‘others’. (B) Microbiota composition at all taxonomic levels in packed circles. The largest circles represent phylum level, and the decreasing circles represent class, order, family and genus. The larger the sector area, the higher the relative abundance of the taxon in the corresponding group. (C) Principal coordinate analysis (PCoA) based on weighted UniFrac distances illustrating community dissimilarities across the three experimental groups |
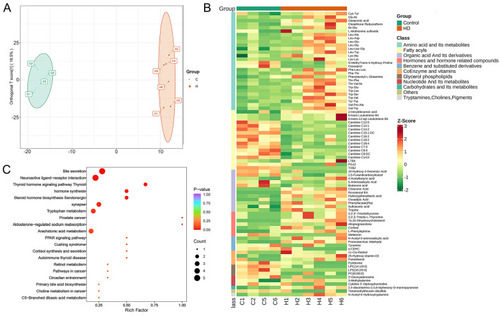
Differences between control and HD groups in gut metabolite composition of zebrafish. (A) OPLS-DA score plot of control and HD groups. (B) Heat map showing the differential metabolites in different categories, with the leftmost column showing the categories in different colors. (C) Bubble diagram of KEGG enrichment results of differential metabolites. |
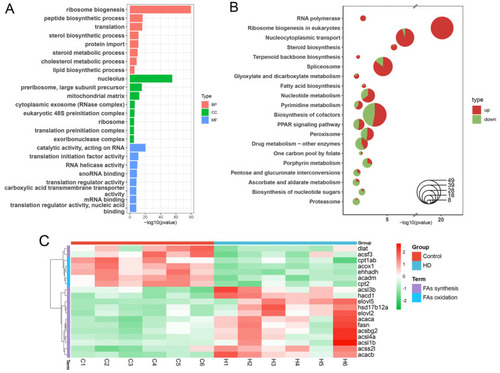
GO and KEGG enrichment analysis of differentially expressed genes (DEGs) in zebrafish liver in control and HD groups. (A) GO enrichment analysis of DEGs. After redundant terms are removed from each category, only the top eight terms in p-value are displayed. (B) KEGG enrichment analysis of DEGs. Red area represents the proportion of upregulated genes in the pathway, and green area represents the proportion of downregulated genes in the pathway. Only the top 15 pathways with p-value are shown, and the ordinate order is from largest to smallest according to the proportion of upregulated genes in the pathways. (C) Heat map of expression levels of DEGs involved in fatty acid synthesis and oxidation. The key genes related to fatty acid synthesis were upregulated, such as fasn, acaca, and acacb, while the key genes related to fatty acid oxidation were downregulated, such as acox1, cpt1ab, and cpt2. |
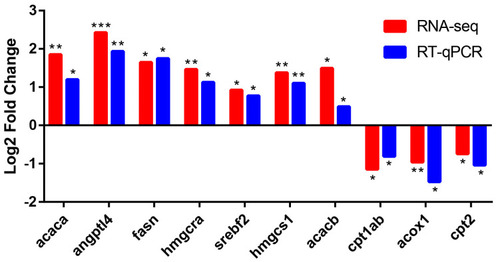
Comparison of RNA-seq data with RT-qPCR data. The x-axis shows the names of genes, and the y-axis indicates the Log2 (Fold Change) with the relative expression (compared to the control group) of each gene. * |
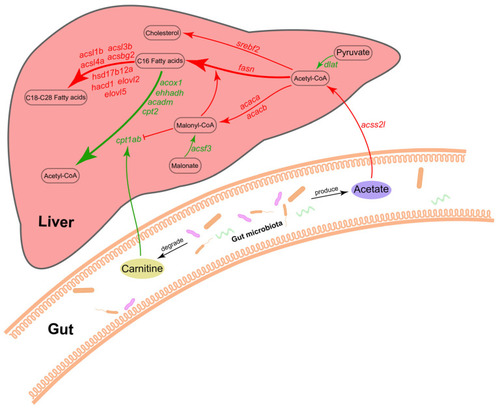
Potential mechanisms for regulation of liver fatty acid metabolism by gut microbiota. Red represents upregulation, and green represents downregulation. |