
Image
|
Figure Caption
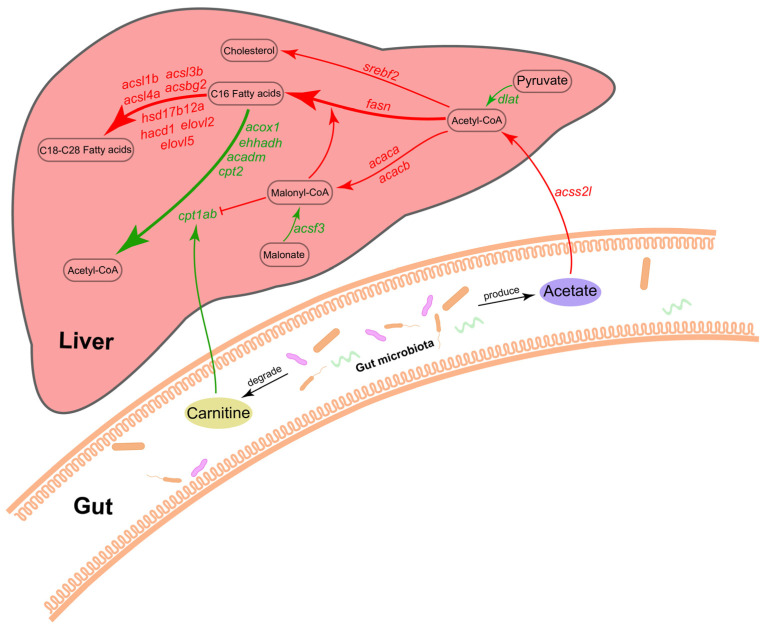
Figure 7
Potential mechanisms for regulation of liver fatty acid metabolism by gut microbiota. Red represents upregulation, and green represents downregulation.
Acknowledgments
This image is the copyrighted work of the attributed author or publisher, and
ZFIN has permission only to display this image to its users.
Additional permissions should be obtained from the applicable author or publisher of the image.
Full text @ Int. J. Mol. Sci.