
|
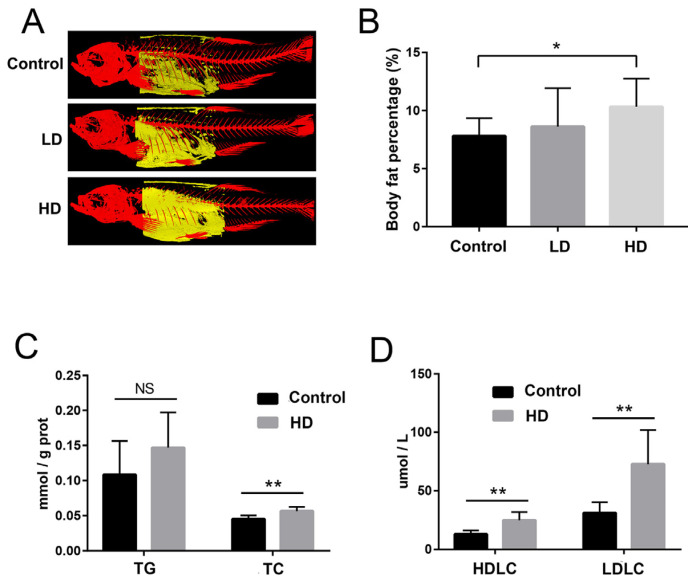
Figure 2 The reconstructed image of body fat revealed by 3D micro-CT, and comparative evaluation of biochemical indexes in zebrafish. (A) Typical images of trunk fat (yellow) of fish in each group based on micro-CT. (B) Percentage of body fat in each group. (C) Bar graph of total triglyceride (TG) and total cholesterol (TC) content in the liver of the control and HD groups. (D) Bar graphs of high-density lipoprotein cholesterol (HDLC) and low-density lipoprotein cholesterol (LDLC) levels in the liver of the control and HD groups. * p-value < 0.05 compared with the control group. ** p-value < 0.01 compared with the control group. “NS” indicates not significant (p > 0.05).