
Figure 3
- ID
- ZDB-FIG-230110-42
- Publication
- Chen et al., 2022 - Bacillus licheniformis FA6 Affects Zebrafish Lipid Metabolism through Promoting Acetyl-CoA Synthesis and Inhibiting β-Oxidation
- Other Figures
- All Figure Page
- Back to All Figure Page
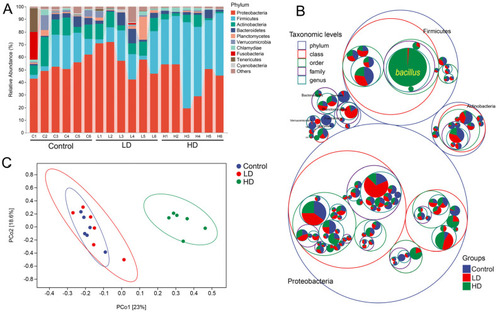
The zebrafish gut microbiota community in the three experimental groups. (A) Composition of microbiota communities in the three groups at phylum level. Each bar represents the community of a sample. Only phyla with a mean relative abundance > 1% are shown; low abundance phyla were assigned to ‘others’. (B) Microbiota composition at all taxonomic levels in packed circles. The largest circles represent phylum level, and the decreasing circles represent class, order, family and genus. The larger the sector area, the higher the relative abundance of the taxon in the corresponding group. (C) Principal coordinate analysis (PCoA) based on weighted UniFrac distances illustrating community dissimilarities across the three experimental groups |