
FIGURE
Figure 4
- ID
- ZDB-FIG-230110-43
- Publication
- Chen et al., 2022 - Bacillus licheniformis FA6 Affects Zebrafish Lipid Metabolism through Promoting Acetyl-CoA Synthesis and Inhibiting β-Oxidation
- Other Figures
- All Figure Page
- Back to All Figure Page
Figure 4
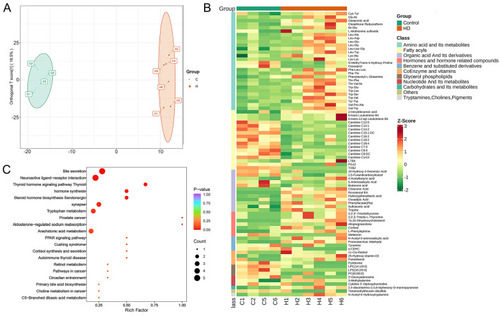
Differences between control and HD groups in gut metabolite composition of zebrafish. (A) OPLS-DA score plot of control and HD groups. (B) Heat map showing the differential metabolites in different categories, with the leftmost column showing the categories in different colors. (C) Bubble diagram of KEGG enrichment results of differential metabolites. |
Expression Data
Expression Detail
Antibody Labeling
Phenotype Data
Phenotype Detail
Acknowledgments
This image is the copyrighted work of the attributed author or publisher, and
ZFIN has permission only to display this image to its users.
Additional permissions should be obtained from the applicable author or publisher of the image.
Full text @ Int. J. Mol. Sci.