
Image
|
Figure Caption
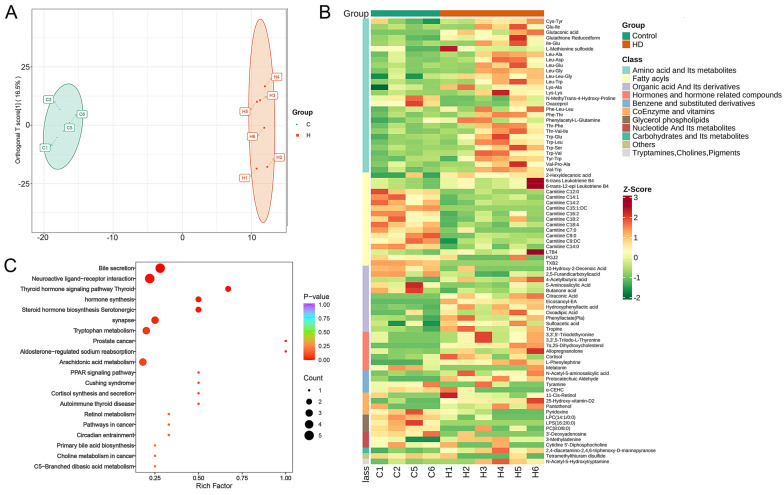
Figure 4 Differences between control and HD groups in gut metabolite composition of zebrafish. (A) OPLS-DA score plot of control and HD groups. (B) Heat map showing the differential metabolites in different categories, with the leftmost column showing the categories in different colors. (C) Bubble diagram of KEGG enrichment results of differential metabolites.
Acknowledgments
This image is the copyrighted work of the attributed author or publisher, and
ZFIN has permission only to display this image to its users.
Additional permissions should be obtained from the applicable author or publisher of the image.
Full text @ Int. J. Mol. Sci.