
FIGURE
Figure 6
- ID
- ZDB-FIG-230110-45
- Publication
- Chen et al., 2022 - Bacillus licheniformis FA6 Affects Zebrafish Lipid Metabolism through Promoting Acetyl-CoA Synthesis and Inhibiting β-Oxidation
- Other Figures
- All Figure Page
- Back to All Figure Page
Figure 6
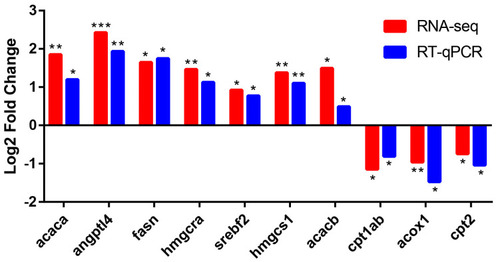
Comparison of RNA-seq data with RT-qPCR data. The x-axis shows the names of genes, and the y-axis indicates the Log2 (Fold Change) with the relative expression (compared to the control group) of each gene. * |
Expression Data
Expression Detail
Antibody Labeling
Phenotype Data
Phenotype Detail
Acknowledgments
This image is the copyrighted work of the attributed author or publisher, and
ZFIN has permission only to display this image to its users.
Additional permissions should be obtained from the applicable author or publisher of the image.
Full text @ Int. J. Mol. Sci.