
- Title
-
Genetic analysis of activin/inhibin β subunits in zebrafish development and reproduction
- Authors
- Zhao, C., Zhai, Y., Geng, R., Wu, K., Song, W., Ai, N., Ge, W.
- Source
- Full text @ PLoS Genet.
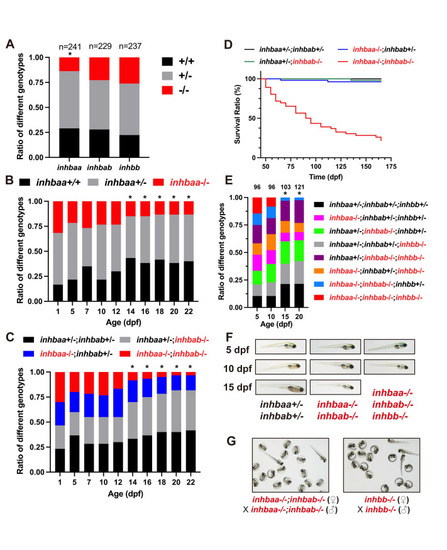
Analysis of survival ratios in activin β subunit mutants.
(A) Ratios of different genotypes in the offspring of heterozygotes (+/- x +/-) at adult stage. (B) Ratios of different genotypes in the offspring of inhbaa+/- x inhbaa+/- from 1 to 22 dpf. Sixty fish were sampled at each time point (n = 60). (C) Ratios of different genotypes in the offspring of inhbaa+/-;inhbab-/- x inhbaa-/-;inhbab+/- from 1 to 22 dpf. Sixty fish were sampled at each time point (n = 60). (D) Kaplan–Meier plot for activin βA single and double mutants (50 to 165 dpf; n = 46–54). (E) Ratios of different genotypes in the offspring of inhbaa+/-;inhbab-/-;inhbb+/- (♀) x inhbaa-/-;inhbab+/-;inhbb-/- (♂) from 5 to 20 dpf. The number of fish examined is shown on top of each column. (F) The larvae of control (inhbaa+/-;inhbab+/-), βA double mutant (inhbaa-/-;inhbab-/-) and βA/B triple mutant (inhbaa-/-;inhbab-/-;inhbb-/-) from 5 to 15 dpf. No triple mutant individuals could survive to 15 dpf. (G) Offspring of inhbaa-/-;inhbab-/- (♀) x inhbaa-/-;inhbab-/- (♂) and inhbb-/- (♀) x inhbb-/- (♂) at 72 hpf. The asterisk indicates significant deviation from expected ratios by Chi-square analysis (p<0.05). PHENOTYPE:
|
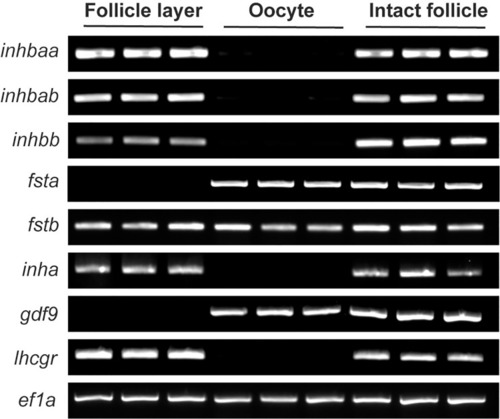
Intrafollicular distribution of activin-inhibin-follistatin system in full-grown (FG) follicles.
The activin β subunits (inhbaa, inhbab and inhbb) and inhibin α (inha) were exclusively expressed in the follicle layer whereas follistatin a (fsta) was exclusively expressed in the oocyte. Follistatin b (fstb) was expressed in both follicle layer and oocyte. The housekeeping gene (ef1a) was expressed in both cell types, while gdf9 and lhcgr were exclusively expressed in oocyte and follicle layer, respectively, indicating clean separation of the two compartments. |
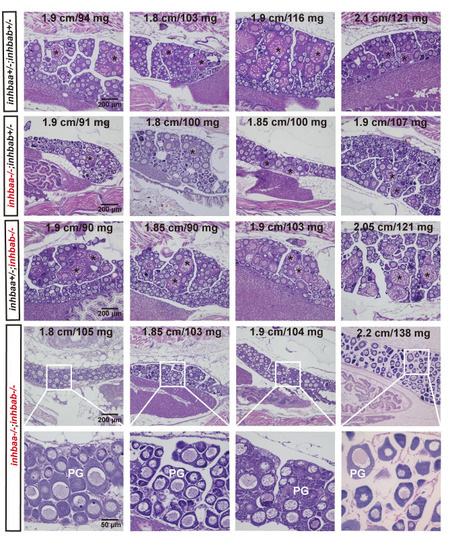
Delayed follicle activation and puberty onset in activin βA double mutant (inhbaa-/-;inhbab-/-) at 45 dpf.
In control (inhbaa+/-;inhbab+/-) and single mutant (inhbaa-/-, inhbab-/-) fish, PV follicles with cortical alveoli in the oocyte started to appear when their BL and BW reached the threshold for puberty onset (1.80 cm/100 mg). However, in the double mutant (inhbaa-/-;inhbab-/-), PV follicles did not appear in many individuals although their body size had reached the threshold. The BL (cm) and BW (mg) of each fish are shown on the top. The asterisk shows PV follicles. PG, primary growth stage. PHENOTYPE:
|
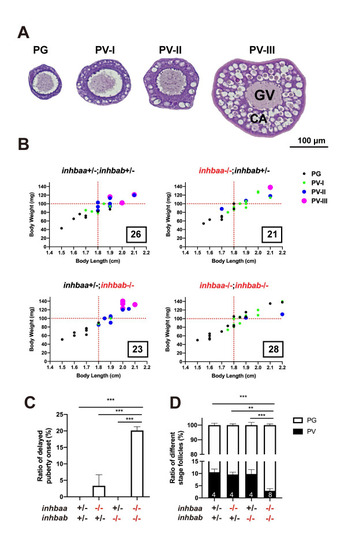
Quantitative analysis for delayed puberty onset in activin βA double mutant (inhbaa-/-;inhbab-/-).
(A) Classification of PV follicles. The PV stage is further divided into three sub-stages according to size and layer number of the cortical alveoli (CA). PV-I, single layer of small CA; PV-II, single layer of large CA; PV-III, multiple layers of large CA. (B) Correlation between PG-PV transition and body size [BL (cm) and BW (mg)]. Dots in different color and size represent different stages of follicles. The number in the box indicates the sample size. (C) Ratios of delayed puberty onset in different activin βA mutants at 45 dpf (n = 3 batches). (D) Follicle composition in the ovary of βA mutants at 45 dpf. Sample size is indicated at the bottom of each column. (**P < 0.01; ***P < 0.001). PG, primary growth; PV, previtellogenic; GV, germinal vesicle. PHENOTYPE:
|
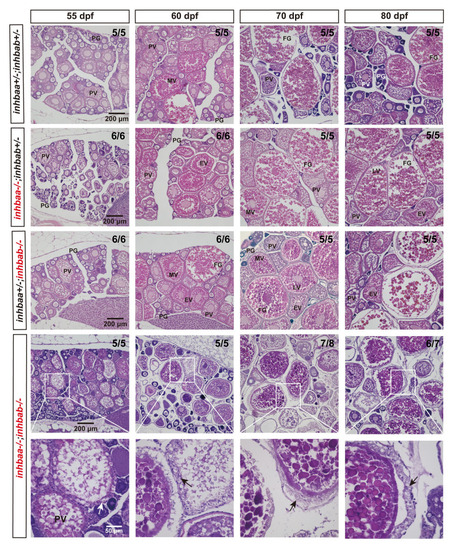
Histological analysis of activin βA mutant females during post-pubertal maturation (55–80 dpf).
Follicles from control and βA single mutants (inhbaa-/-, inhbab-/-) showed normal growth and development. In the double mutant (inhbaa-/-;inhbab-/-), abnormal follicles with hypertrophic granulosa cells could often be observed (arrow). The boxed areas are shown at higher magnification below. The numbers shown in the photos indicate the total number of fish examined (lower) and the fish exhibiting similar phenotype to that shown (upper). PG, primary growth; PV, previtellogenic; EV, early vitellogenic; MV, mid-vitellogenic; LV, late vitellogenic; FG, full-grown. PHENOTYPE:
|
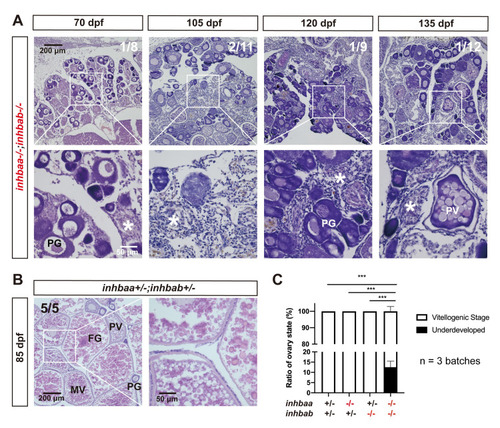
Failure of follicle activation and defective folliculogenesis in activin βA double mutant (inhbaa-/-;inhbab-/-).
(A) Ovary of some mutant individuals (~10%) at 70–135 dpf. The ovary contained PG follicles only at 70 dpf, and much of the inter-follicular space was filled with abundant stromal cells. At later development stages (105, 120 and 135 dpf), PV follicles could occasionally be observed; however, there were no vitellogenic follicles and the ovaries were mostly occupied by over-proliferated stromal cells. The boxed areas are shown at higher magnification below. The numbers shown in the photos indicate the total number of fish examined (lower) and the fish exhibiting similar phenotype to that shown (upper). (B) Ovary in the control fish (inhbaa+/-;inhbab+/-) at 85 dpf. Vitellogenic follicles developed normally in the control. (C) Statistical analysis of ovarian types from 105 to 135 dpf (***p < 0.001; n = 3 batches). PG, primary growth; PV, previtellogenic; MV, mid-vitellogenic; FG, full-grown; asterisk, infiltrating stromal tissue. PHENOTYPE:
|
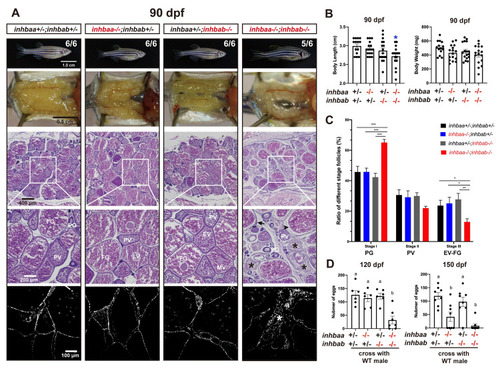
Follicle development and fecundity in young and mature females of βA mutants.
(A) Morphology, gross anatomy and histological analysis of activin βA female mutants at 90 dpf. Follicles from the control (inhbaa+/-;inhbab+/-) and single mutants (inhbaa-/-, inhbab-/-) showed normal growth and ovarian development. The double mutant (inhbaa-/-;inhbab-/-) started to show stromal cell hyperplasia (asterisk), granulosa cell hypertrophy (arrow) and follicle atresia (arrowhead). The overproliferation of the stromal cells is also shown by DAPI staining for nuclei (bottom). The boxed areas are shown at higher magnification below. The numbers shown in the photos indicate the total number of fish examined (lower) and the fish exhibiting similar phenotype to that shown (upper). (B) Body length and body weight of activin βA mutants at 90 dpf. (C) Follicle composition in the ovaries of the activin βA mutants at 90 dpf (n = 5). (*p < 0.05; **p < 0.01; ***p < 0.001). PG, primary growth (stage I); PV, previtellogenic (stage II); EV-FG, vitellogenic (stage III). (D) Fertility and fecundity of activin βA female mutants at 120 and 150 dpf. The mutant females were bred with normal WT males by natural breeding. Different letters indicate statistical significance (p < 0.05). Each dot represents the average egg number of four females from each spawning test (n = 6-8 tests). |
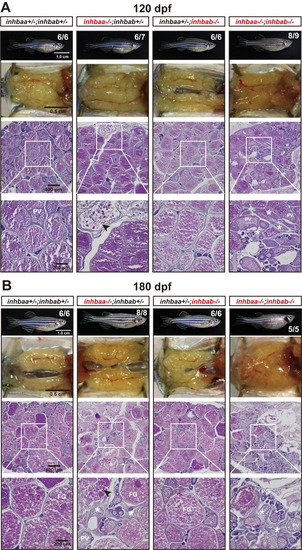
Ovaries of activin βA female mutants at 120 dpf (A) and 180 dpf (B). Follicles in the control (inhbaa+/-;inhbab+/-) and inhbab single mutant (inhbab-/-) were normal. The inhbaa single mutant (inhbaa-/-) and double mutant (inhbaa-/-;inhbab-/-) often contained degenerative or atretic vitellogenic follicles (arrowhead) and abundant stromal cells in the inter-follicular space (asterisk). The boxed areas are shown at higher magnification below. The numbers shown in the photos indicate the total number of fish examined (lower) and the fish exhibiting similar phenotype to that shown (upper). PHENOTYPE:
|
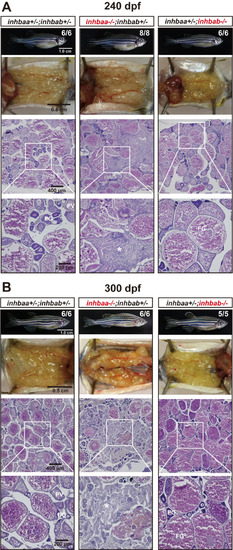
Ovaries of activin βA female mutants at 240 dpf (A) and 300 (B) dpf. The control and inhbab single mutant fish showed normal ovarian morphology and structure whereas the inhbaa mutant showed severe ovarian disorganization and dysfunction. Much of the space in the inhbaa-/- ovary was occupied by stromal cells and fibrous tissues (asterisk). The boxed areas are shown at higher magnification below. The numbers shown in the photos indicate the total number of fish examined (lower) and the fish exhibiting similar phenotype to that shown (upper). PG, primary growth; PV, pre-vitellogenic; FG, full-grown. PHENOTYPE:
|
Long-term effect of inhbaa deficiency on ovarian maintenance.
Tumour/cyst-like tissues (arrow) accumulated in the ovary of all individuals examined at ~18 mpf (> 540 dpf). The folliculogenesis had ceased with follicles arrested at PG stage and the ovaries contained abundant stromal cells and fibrous tissues (asterisk). The control and inhbab-/- fish showed normal ovarian structure. The boxed areas are shown at higher magnification below. The numbers shown in the photos indicate the total number of fish examined (lower) and the fish exhibiting similar phenotype to that shown (upper). PG, primary growth; FG, full-grown. PHENOTYPE:
|
Phenotype analysis of activin βB mutant females at different stages (45–270 dpf).
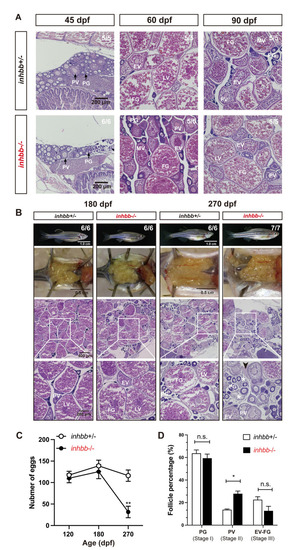
(A) Histology of ovaries from 45 to 90 dpf. The βB mutant (inhbb-/-) showed no abnormalities in follicle growth and composition compared with the control (inhbb+/-). (B) Histology of ovaries at 180 and 270 dpf. The mutant ovary remained normal at 180 dpf; however, the condition started to deteriorate at 270 dpf with significant changes in follicle composition and accumulation of stromal cells (asterisk) and fluid (arrowhead) between follicles. The numbers shown in the photos indicate the total number of fish examined (lower) and the fish exhibiting similar phenotype to that shown (upper). (C) Fecundity of control (inhbb+/-) and mutant (inhbb-/-) females at different times (120, 180 and 270 dpf). The female fish were bred with normal WT males by natural breeding, and the number of eggs released by each fish was counted and analyzed (**p < 0.01, n = 4). The fecundity of mutant females (inhbb-/-) dropped sharply at 270 dpf. (D) Follicle composition in the control (inhbb+/-) and mutant (inhbb-/-) ovaries at 270 dpf. The mutant fish contained more PV follicles but less vitellogenic follicles (EV-FG) at 270 dpf (*P < 0.05, n = 4 for inhbb+/- and 5 for inhbb-/-). PG, primary growth; PV, pre-vitellogenic; EV, early vitellogenic; MV, mid-vitellogenic; LV, late vitellogenic; FG, full-grown; n.s., no significance. PHENOTYPE:
|
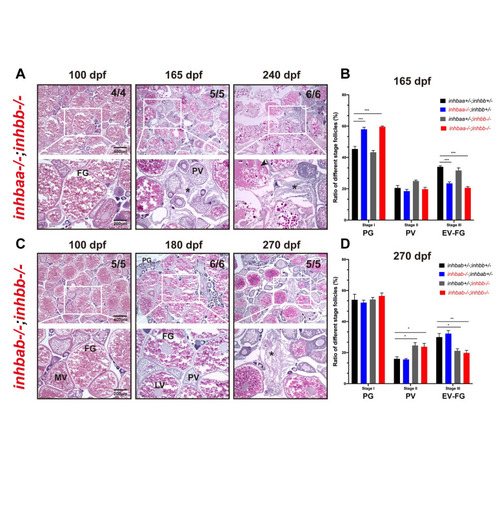
Phenotype analysis of βA and βB double mutants.
Double mutants involving both βA and βB subunits were created (inhbaa-/-;inhbb-/-, and inhbab-/-;inhbb-/-) and their ovaries examined at different time points (100–270 dpf). (A) Histological analysis of inhbaa-/-;inhbb-/- from 100 to 240 dpf. (B) Follicle composition in the ovaries of the inhbaa;inhbb mutants at 165 dpf (*** p < 0.001, n = 4). (C) Histological analysis of inhbab-/-;inhbb-/- from 100 to 270 dpf. (D) Follicle composition in the ovaries of the inhbab;inhbb mutants at 270 dpf (* p < 0.05; ** p < 0.01, n = 4). No interactive effects were observed between βA and βB in terms of histological structure and follicle composition. The double mutants phenocopied the single mutants inhbaa-/- and inhbb-/-, respectively, showing similar ovarian disorganization, follicle degeneration, and accumulation of somatic stromal cells (asterisk) and fluid (arrowhead) at 165 and 240 dpf for inhbaa-/-;inhbb-/- and 270 dpf for inhbab-/-;inhbb-/-. The numbers shown in the photos indicate the total number of fish examined (lower) and the fish exhibiting similar phenotype to that shown (upper). PV, pre-vitellogenic; MV, mid-vitellogenic; LV, late vitellogenic; FG, full-grown. |
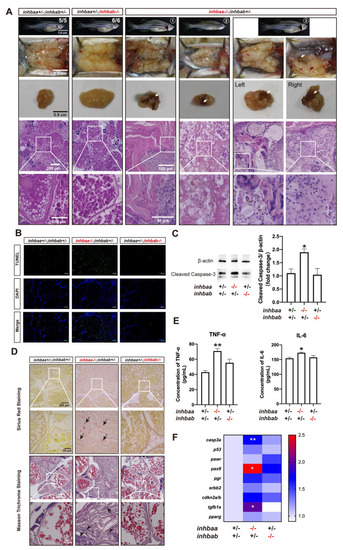
Ovarian disorders in aged inhbaa-/- mutant.
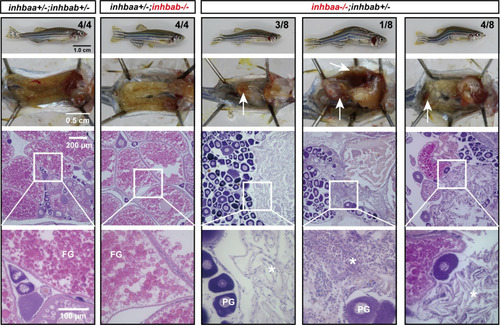
(A) Tumorigenesis in mutant ovaries (>12 mpf). Tumor-like tissues or cysts accumulated in the mutant ovary unilaterally or bilaterally around one-year post-fertilization in all individuals examined (7 in total), and 3 fish contained brownish tissues of different sizes (arrow) (3/7). The fish on the right had the brown tissues on both ovaries. The boxed areas are shown at higher magnification below. (B) TUNEL staining for apoptosis in the ovary. Large areas of somatic cells in the ovary of inhbaa-/- but not inhbab-/- mutant showed strong TUNEL signals at 240 dpf. (C) Western blotting analysis for cleaved Caspase-3 in the ovary of βA single mutants (inhbaa-/-, inhbab-/-) at 240 dpf (n = 3). (D) Sirius red and Masson trichrome staining of the ovarian tissues in different genotypes of the βA mutants at 240 dpf. Arrows indicate staining of collagen fibers. The boxed areas are shown at higher magnification below. (E) Concentrations of two proinflammatory cytokines, TNF-α and IL-6, in the ovary of βA mutants at 240 dpf (n = 3). (F) Expression of genes involved in apoptosis (casp3a and p53), ovarian tumors (pawr, pax8, pgr, erbb2 and cdkn2a/b) and fibrosis (tgfb1a and pparg) in the βA mutants at 240 dpf (*p < 0.05; **p < 0.01; n = 5). |
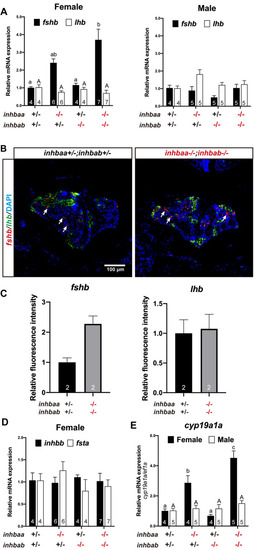
Expression analysis of pituitary and gonadal genes in activin β mutants.
(A) Expression of fshb and lhb in the pituitary of activin βA mutants at 90 dpf. (B) Fluorescence in situ hybridization for fshb (arrows) and lhb in female pituitaries of the control (inhbaa+/-;inhbab+/-) and double mutant (inhbaa-/-;inhbab-/-) at 90 dpf. (C) Quantification of the in situ hybridization signals in the double mutant (n = 2). (D) Expression of inhbb and fsta in the pituitary of activin βA female mutants at 90 dpf. (E) Expression of aromatase (cyp19a1a) in the ovary and testis of the βA mutants at 90 dpf. Sample size is indicated in each column, and different letters in each dataset indicate statistical significance (p < 0.05). |
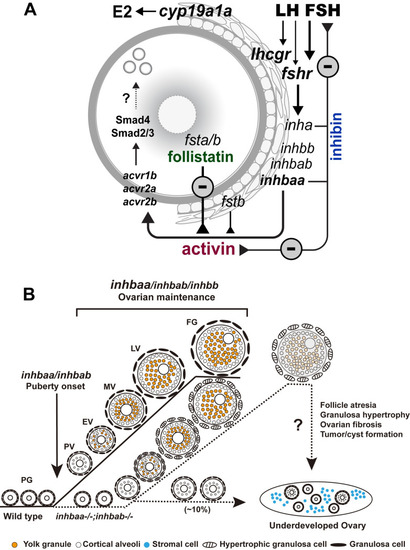
Working model on activin-inhibin-follistatin system in zebrafish ovary.
(A) Intrafollicular distribution of the activin-inhibin-follistatin system. All activin/inhibin β subunits (inhbaa, inhbab and inhbb) are exclusively expressed in the somatic follicle cells together with inhibin α subunit (inha). In contrast, follistatin a (fsta) is exclusively expressed by the oocyte whereas fstb is expressed in both cell types. Activins from the follicle cells may act directly on the oocyte to control its gene expression. In addition to antagonizing activin, inhibin from the follicle cells also feeds back to the pituitary to control gonadotropin expression and secretion especially FSH. (B) Roles of activin/inhibin β subunits in folliculogenesis. Activin plays important roles in controlling follicle activation and maintaining normal folliculogenesis. Activin βA (inhbaa and inhbab) appears more important than βB (inhbb), especially inhbaa whose functions can be partially compensated by inhbab. The βAa (inhbaa) may also be the main β subunit that contributes to the formation of inhibin (αβ). |