
Fig 11
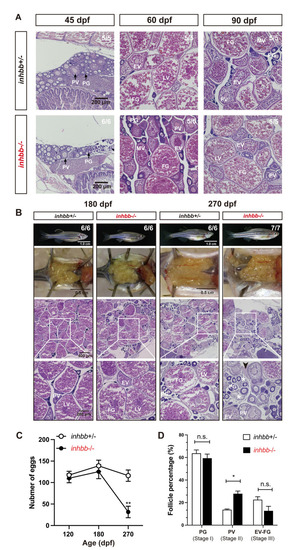
Phenotype analysis of activin βB mutant females at different stages (45–270 dpf).
(A) Histology of ovaries from 45 to 90 dpf. The βB mutant (inhbb-/-) showed no abnormalities in follicle growth and composition compared with the control (inhbb+/-). (B) Histology of ovaries at 180 and 270 dpf. The mutant ovary remained normal at 180 dpf; however, the condition started to deteriorate at 270 dpf with significant changes in follicle composition and accumulation of stromal cells (asterisk) and fluid (arrowhead) between follicles. The numbers shown in the photos indicate the total number of fish examined (lower) and the fish exhibiting similar phenotype to that shown (upper). (C) Fecundity of control (inhbb+/-) and mutant (inhbb-/-) females at different times (120, 180 and 270 dpf). The female fish were bred with normal WT males by natural breeding, and the number of eggs released by each fish was counted and analyzed (**p < 0.01, n = 4). The fecundity of mutant females (inhbb-/-) dropped sharply at 270 dpf. (D) Follicle composition in the control (inhbb+/-) and mutant (inhbb-/-) ovaries at 270 dpf. The mutant fish contained more PV follicles but less vitellogenic follicles (EV-FG) at 270 dpf (*P < 0.05, n = 4 for inhbb+/- and 5 for inhbb-/-). PG, primary growth; PV, pre-vitellogenic; EV, early vitellogenic; MV, mid-vitellogenic; LV, late vitellogenic; FG, full-grown; n.s., no significance. |
| Fish: | |
|---|---|
| Observed In: | |
| Stage Range: | Days 45-89 to Adult |