
FIGURE
Fig 9
Fig 9
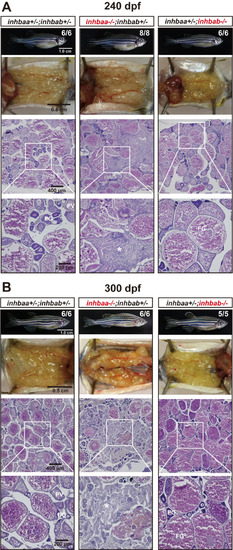
Ovaries of activin βA female mutants at 240 dpf (A) and 300 (B) dpf. The control and inhbab single mutant fish showed normal ovarian morphology and structure whereas the inhbaa mutant showed severe ovarian disorganization and dysfunction. Much of the space in the inhbaa-/- ovary was occupied by stromal cells and fibrous tissues (asterisk). The boxed areas are shown at higher magnification below. The numbers shown in the photos indicate the total number of fish examined (lower) and the fish exhibiting similar phenotype to that shown (upper). PG, primary growth; PV, pre-vitellogenic; FG, full-grown. |
Expression Data
Expression Detail
Antibody Labeling
Phenotype Data
| Fish: | |
|---|---|
| Observed In: | |
| Stage: | Adult |
Phenotype Detail
Acknowledgments
This image is the copyrighted work of the attributed author or publisher, and
ZFIN has permission only to display this image to its users.
Additional permissions should be obtained from the applicable author or publisher of the image.
Full text @ PLoS Genet.