
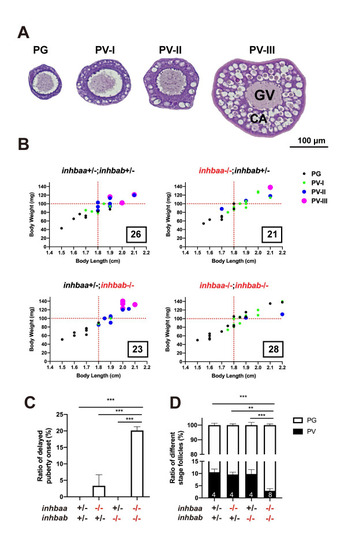
Fig 4
Quantitative analysis for delayed puberty onset in activin βA double mutant (inhbaa-/-;inhbab-/-).
(A) Classification of PV follicles. The PV stage is further divided into three sub-stages according to size and layer number of the cortical alveoli (CA). PV-I, single layer of small CA; PV-II, single layer of large CA; PV-III, multiple layers of large CA. (B) Correlation between PG-PV transition and body size [BL (cm) and BW (mg)]. Dots in different color and size represent different stages of follicles. The number in the box indicates the sample size. (C) Ratios of delayed puberty onset in different activin βA mutants at 45 dpf (n = 3 batches). (D) Follicle composition in the ovary of βA mutants at 45 dpf. Sample size is indicated at the bottom of each column. (**P < 0.01; ***P < 0.001). PG, primary growth; PV, previtellogenic; GV, germinal vesicle. |
| Fish: | |
|---|---|
| Observed In: | |
| Stage: | Days 45-89 |