
- Title
-
N-myc downstream regulated gene 1 (ndrg1) functions as a molecular switch for cellular adaptation to hypoxia
- Authors
- Park, J.S., Gabel, A.M., Kassir, P., Kang, L., Chowdhary, P.K., Osei-Ntansah, A., Tran, N.D., Viswanathan, S., Canales, B., Ding, P., Lee, Y.S., Brewster, R.
- Source
- Full text @ Elife
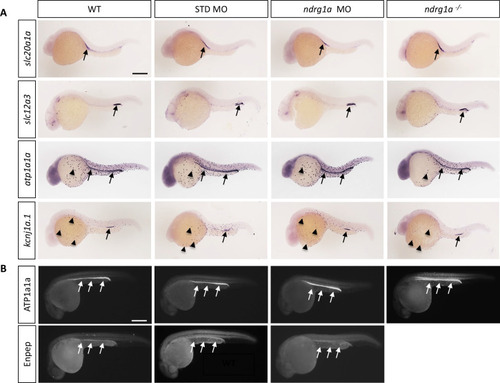
(A, B) Lateral views of 24 hpf WT, standard MO-injected, ndrg1a MO-injected and ndrg1a-/- mutant embryos labeled using (A) wholemount in situ hybridization to detect the mRNA distribution of slc20a1a, slc12a3, atp1a1a, and kcnj1a.1 (n=3–4 experiments with an average of 36 embryos per riboprobe) and (B) immunolabeling with anti-ATP1A1A or anti-GFP in Tg[enpep:GFP] transgenic line (n=3–4 experiments with an average of 40 embryos per antibody). Annotations: arrows point to signal in the pronephric duct; arrowheads: ionocytes. Scale bars 300 μm.
|
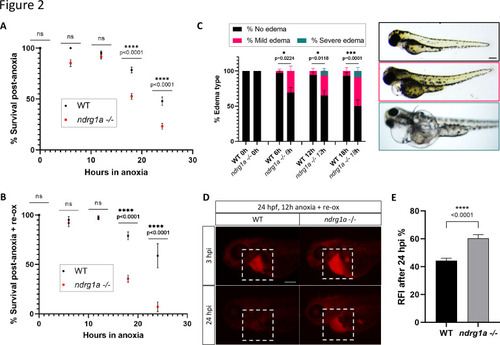
(A) % Survival of WT embryos and ndrg1a-/- mutants immediately following 6, 12, 18, and 24 hr of anoxia exposure. Embryos were 24 hpf at the time of exposure. A significant difference between WT and mutants was observed for 12 and 18 hr of anoxia (Two-way ANOVA analysis was performed; 0 hr WT vs. ndrg1a-/-: p-value > 0.9999, ns; 6 hr WT vs. ndrg1a-/-: p-value = 0.0793, ns; 12 hr WT vs. ndrg1a-/-: p-value = 0.9941, ns; 18 hr WT vs. ndrg1a-/-: p-value < 0.0001, ****; 24 hr WT vs. ndrg1a-/-: p-value < 0.0001, ****; n=5–8 experiments with an average of 171 embryos per experimental group; Figure 2—source data 1). (B) % Survival of WT embryos and ndrg1a-/-mutants following 6, 12, 18, and 24 hr of anoxia exposure and 2 days of re-oxygenation (re-ox). Embryos were 24 hpf at the time of initial anoxia exposure. A significant difference between WT and mutants was observed for 18 and 24 hr of anoxia + 2 re-ox (Two-way ANOVA analysis was performed; 0h+re ox WT vs. ndrg1a-/-: p-value > 0.9999, ns; 6 hr+re ox WT vs. ndrg1a-/-: p-value > 0.9999, ns; 12hr+re ox WT vs. ndrg1a-/-: p-value > 0.9999, ns; 18 hr+re ox WT vs. ndrg1a-/-: p-value < 0.0001, ****; 24 hr+re ox WT vs. ndrg1a-/-: p-value < 0.0001, ****; n=2–5 experiments with an average of 66 embryos per experimental group; Figure 2—source data 2). (C, left) % Edema observed in WT embryos and ndrg1a-/-mutants following 0, 6, 12, 18, and 24 hr of anoxia exposure and 2 days re-ox. Edema phenotypes were divided into three categories: no edema, mild edema and severe edema. A significant difference between WT and mutants was observed for 6, 12, and 18 hr of anoxia + 2 days re-ox for the presence of either mild or severe edema (Two-way ANOVA analysis was performed; 0 hr+re ox WT vs. ndrg1a-/-: p-value > 0.9999, ns; 6 hr+re ox WT vs. ndrg1a-/-: p-value = 0.0224, *; 12 hr+re ox WT vs. ndrg1a-/-: p-value = 0.0118, *; 18 hr+re ox WT vs. ndrg1a-/-: p-value = 0.0001, ***). (C, right) Representative images of embryos in each phenotypic category (n=2–3 experiments with an average of 36 embryos per experimental group; Figure 2—source data 3). Scale bar 200 μm. (D) Lateral views of injected embryos were taken 3 and 24 hr post-injection (hpi). White boxes indicate where fluorescence measurements were taken. Scale bar 200 μm. (E) Quantification of kidney clearance assay using 24 hpf WT embryos and ndrg1a-/-mutants exposed to 12 hr of anoxia, followed by 2 days re-ox and injection with rhodamine dextran. A significant difference between WT and mutants was observed 24 hpi (unpaired t test; p-value < 0.0001, ****). (n=2 experiments with an average of 18 embryos per experiment; Figure 2—source data 4).
|
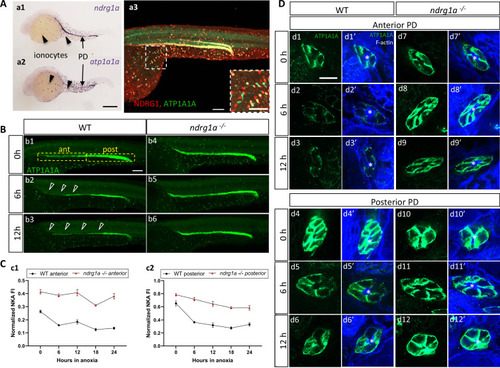
(A) Lateral views of 24 hpf WT embryos revealing (a.1,2) ndrg1a and atp1a1a transcript distribution using whole-mount in situ hybridization. (a.3) Ndrg1a and ATP1A1A protein distribution using double immunolabeling. Scale bars: a1, a2: 300 μm, a3: 100 μm for both wholemount and inset. (B) Lateral views of WT embryos and ndrg1a-/- mutants exposed at 24 hpf to increasing duration of anoxia: (b1, b4) 0 hr; (b2, b5) 6 hr; (b3, b6) 12 hr and immunolabeled to reveal ATP1A1A. (n=3 experiments with an average of 29 embryos processed per experiment). Scale bar 100 μm. Abbreviations: ant = anterior, post = posterior. Annotations: yellow boxes show where anterior and posterior pronephric duct measurements were taken. Arrowheads indicate decreased signal. (C) Normalized fluorescence intensity in the (c1) anterior and (c2) posterior pronephric duct of WT embryos and ndrg1a-/- mutants. Embryos were exposed at 24 hpf to increasing duration of anoxia (0, 6, 12, 18, and 24 hr) and immunolabeled to reveal ATP1A1A levels. (n=3 experiments with an average of 21 pronephros segments processed per experimental group; Figure 3—source data 1). (D) Cross-sections views of the anterior (d1-d3’, d7-d9’) and posterior (d4-d6’, d10-d12’) pronephric ducts in WT embryos (d1-d3’, d4-d6’) and ndrg1a-/- mutants (d7-d9’, d10-d12’), labeled with anti-ATP1A1A and phalloidin (F-actin). (n=3 experiments with an average of 61 pronephric duct cross-sections processed per experimental group). Scale bar 20 μm. Annotations: asterisks indicate the lumen (apical surface of PD cells).
|
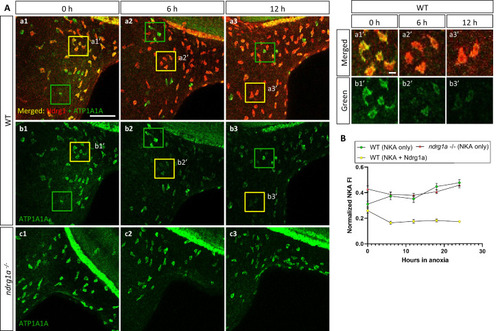
(A, left) Lateral views of WT embryos (a1–b3) and ndrg1a-/- mutants (c1–c3) exposed to anoxia for 0 hr (a1–c1), 6 hr (a2–c2), 12 hr (a3–c3) and immunolabeled with anti-ATP1A1A (green) and anti-Ndrg1a (red); (a1–a3) show merged channels, while (b1–c3) show the green (ATP1A1A) channel only. Annotations: yellow and green boxes identify ionocytes that are positive for Ndrg1a and ATP1A1A (yellow) or ATP1A1A-only (green). Scale bar: a1: 100 μm; a1’: 2 μm. (A, right) Higher magnification images of yellow boxed in areas in (a1-b3), showing merged channels (a1’-a3’) and green channel only (b1’-b3’). (B) Normalized fluorescence intensity of ATP1A1A in ionocytes of WT embryos and ndrg1a-/- mutants exposed to anoxia for 0, 6, 12, 18, and 24 hr. (n=3 experiments with an average of 37 ionocytes processed per experimental group; Figure 4—source data 1).
|
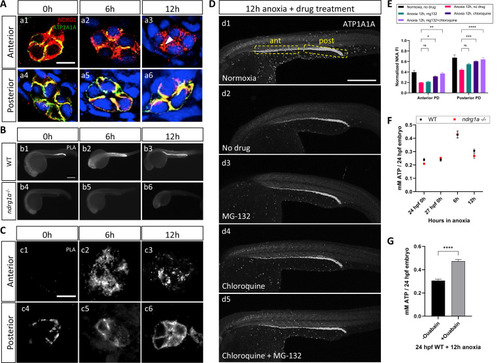
(A) Cross-sections of WT embryos exposed to anoxia for 0 hr (a1, a4), 6 hr (a2, a5), and 12 hr (a3, a6) and immunolabeled with anti-ATP1A1A (green) and anti-Ndrg1a (red). (a1–a3) Anterior pronephric duct. (a4–a6) Posterior pronephric duct. (n=3 experiments with an average of 33 pronephros sections processed per experimental group). Scale bar = 10 μm. (B) Lateral views of WT (b1–b3) and ndrg1a-/- (b4–b6) embryos labeled using whole-mount proximity ligation assay (PLA) to reveal Ndrg1a and ATP1A1A interaction. Embryos were exposed to 0 hr (b1, b4), 6 hr (b2, b5), and 12 hr (b3, b6) of anoxia (n=4 experiments with an average of 14 embryos processed per experimental group). Scale bar = 300 μm. (C) Cross-sections through the anterior (c1–c3) and posterior (c4–c6) pronephric duct of WT embryos treated as in (b1–b3) (n=2 experiments with an average of 23 pronephros sections processed per experimental group). Scale bar = 10 μm. (D) Lateral views of WT embryos exposed to 0 hr (d1) or 12 hr of anoxia (d2–d5) in presence or absence of MG-132 (100 μM, proteasome inhibitor), or Chloroquine (10 mM, autophagy inhibitor), or both and immunolabeled using anti-ATP1A1A. Annotation: yellow boxes show where anterior and posterior pronephric duct measurements were taken. Scale bar 200 μm. (E) Quantification of ATP1A1A fluorescence intensity in the pronephric duct of embryos subjected to the same anoxia and drug treatments as shown in (D). (Two-way ANOVA analysis was performed; Anterior PD: 7% increase in Anoxia 12 hr, mg132 vs Anoxia 12 hr, no drug p>0.9999 ns; 59% increase in Anoxia 12 hr, chloroquine vs Anoxia 12 hr, no drug p=0.0298 *; 87% increase in Anoxia 12 hr mg132 + chloroquine vs Anoxia 12 hr, no drug p=0.0013 **. Posterior PD: 24% increase in Anoxia 12 hr, mg132 vs Anoxia 12 hr, no drug p=0.0640 ns, 36% increase in Anoxia 12 hr, chloroquine vs Anoxia 12 hr, no drug p=0.0002 ***, 45% increase in Anoxia 12 hr mg132 + chloroquine vs Anoxia 12 hr, no drug p<0.0001 ****. (n=2 experiments, representative data shown for 1 experiment with an average of 14 pronephros segments processed per experimental group; Figure 5—source data 1). (F) Quantification of total ATP concentration per WT embryo or ndrg1a-/- mutant exposed to 0 (24 hpf or 27 hpf developmental stage control), 6, 12 hr of anoxia. No significant difference between WT and mutants were observed. Two-way ANOVA analysis was performed; 0 hr (24 hpf) WT vs. ndrg1a-/-: p-value = 0.9553, ns; 0 hr (27 hpf developmental stage control) WT vs. ndrg1a-/-: p value => 0.9999, ns; 6 h WT vs. ndrg1a-/-: p value => 0.9999, ns; 12 hr WT vs. ndrg1a-/-: p-value = 0.7652, ns). (n=5 experiments with an average of 15–20 embryos per experimental group; Figure 5—source data 2). (G) Quantification of total ATP concentration per WT embryo under anoxia either treated with or without 3 mM of ouabain. (Unpaired t test was performed; WT + Ouabain and Anoxia vs. WT + Anoxia only: p value =< 0.0001, ****; Figure 5—source data 3).
|
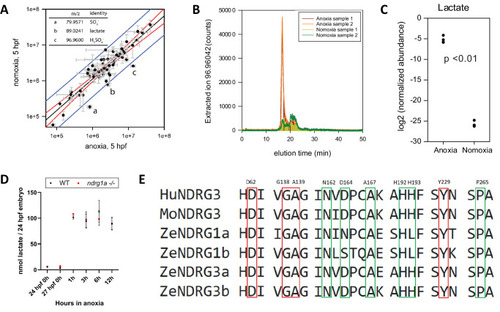
(A graph) Metabolites enriched in anoxia-treated embryos relative to normoxic controls. X axis: metabolite levels (integrated ion counts) in extracts from 5 hpf embryos exposed to 1 hr of anoxia; Y axis: metabolite levels (integrated ion counts) in extracts from age-matched 5 hpf normoxic controls. The red lines show the predicted correlation line (99% confidence). Blue lines demarcate outliers (99% confidence). Three potential outliers (a, b and c) were identified (n=10 embryos per sample and 2 technical repeats). (A, insert, top left) Identity of the three outliers (a–c) that are significantly enriched in the anoxia-treated sample. (B) Extracted ion counts for different elution timepoints are shown for two extracts from 5 hpf embryos exposed to 1 hr of anoxia (orange and red lines) and two control samples from 5 hpf normoxic embryos (yellow and green lines). The peak corresponds to lactate. (C) Comparison of lactate levels (highest peak intensity) in extracts from 5 hpf embryo exposed to 1 hr of anoxia and 5 hpf normoxic controls reveals an 18 fold increase (unpaired t test; p<0.01);Figure 6—source data 1A-C . (D) Fluorometric lactate assay quantification of total lactate concentration (in nmol lactate) per WT embryo or ndrg1a-/- mutant exposed to 0 (24 hpf or 27 hpf developmental stage control), 1, 3, 6, 12 hr of anoxia. No significant difference between WT and mutants were observed. Two-way ANOVA analysis was performed; 0 hr (24 hpf) WT vs. ndrg1a-/-: p value => 0.9999, ns; 0 hr (27 hpf developmental stage control) WT vs. ndrg1a-/-: p value => 0.9999, ns; 1 hr WT vs. ndrg1a-/-: p value => 0.9999, ns; 3 hr WT vs. ndrg1a-/-: p value => 0.9999, ns; 6 hr WT vs. ndrg1a-/-: p value = 0.9870, ns; 12 hr WT vs. ndrg1a-/-: p value => 0.9999, ns. (n=4 experiments with an average of 15 embryos per experimental group; Figure 6—source data 2). (E) Alignment of members of the NDRG family revealing lactate-docking residues, identified in NDRG3 by Lee et al., 2015. Green and red residues represent amino acids in NDRG3 that are 5 ångström from lactate. Red residues represent amino acids that may be critical for the interaction between NDRG3 and lactate.
|
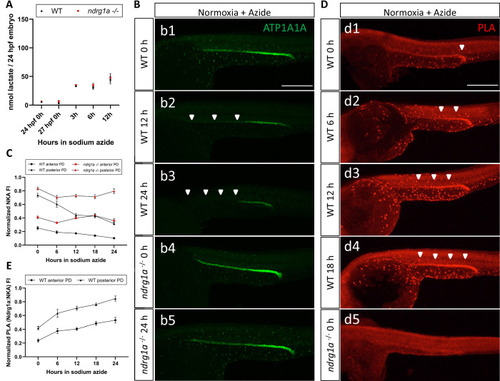
(A) Fluorometric lactate assay quantification of total lactate concentration (in nmol lactate) per WT embryo or ndrg1a-/- mutant exposed to 0 (24 hpf or 27 hpf developmental stage control), 3, 6, 12 hr of 300 uM of azide. No significant difference between WT and mutants were observed. Two-way ANOVA analysis was performed; 0 hr (24 hpf) WT vs. ndrg1a-/-: p value => 0.9999, ns; 0 hr (27 hpf developmental stage control) WT vs. ndrg1a-/-: p-value = 0.9994, ns; 3 hr WT vs. ndrg1a-/-: p value => 0.9999, ns; 6 hr WT vs. ndrg1a-/-: p-value = 0.9919, ns; 12 hr WT vs. ndrg1a-/-: p-value = 0.9986, ns. (n=4 experiments with an average of 15 embryos per experimental group; Figure 7—source data 1). (B) Lateral views of WT embryos and ndrg1a-/- mutants exposed at 24 hpf to increasing duration of azide under normoxia: (b1-5); 0 hr (b1, b4), 12hr (b2), 24 hr (b3, b5) and immunolabeled to reveal ATP1A1A. Arrowheads indicate decreased signal. (n=3 experiments with an average of 10 embryos processed per experimental group). Scale bar 300 μm. (C) Normalized NKA fluorescence intensity in the anterior (circle) and posterior (triangle) pronephric duct of WT (black) embryos and ndrg1a-/- (red) mutants. Embryos were exposed at 24 hpf to increasing duration of azide under normoxia (0, 6, 12, 18, and 24 hr) and immunolabeled to reveal ATP1A1A levels (n=2 experiments with an average of 19 pronephros segments processed per experimental group; Figure 7—source data 2). (D) Lateral views of WT embryos (d1-4) and an ndrg1a-/- mutant (d5) labeled using whole-mount proximity ligation assay (PLA) to reveal Ndrg1a and ATP1A1A interaction. Embryos were raised under normoxic conditions in the presence (6, 12, 18, 24 hr exposure) or absence of sodium azide. Annotations: arrowheads point to PLA signal (n=4 experiments with an average of 10 embryos processed per experimental group). Scale bar 300 μm. (E) Normalized PLA intensity in the anterior (circle) and posterior (triangle) pronephric duct of WT embryo. (n=2 experiments with an average of 16 pronephros segments processed per experimental group; Figure 7—source data 3).
|