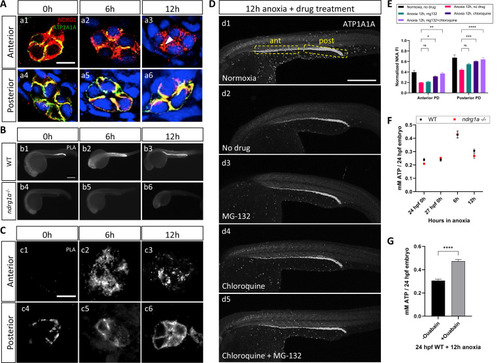
(A) Cross-sections of WT embryos exposed to anoxia for 0 hr (a1, a4), 6 hr (a2, a5), and 12 hr (a3, a6) and immunolabeled with anti-ATP1A1A (green) and anti-Ndrg1a (red). (a1–a3) Anterior pronephric duct. (a4–a6) Posterior pronephric duct. (n=3 experiments with an average of 33 pronephros sections processed per experimental group). Scale bar = 10 μm. (B) Lateral views of WT (b1–b3) and ndrg1a-/- (b4–b6) embryos labeled using whole-mount proximity ligation assay (PLA) to reveal Ndrg1a and ATP1A1A interaction. Embryos were exposed to 0 hr (b1, b4), 6 hr (b2, b5), and 12 hr (b3, b6) of anoxia (n=4 experiments with an average of 14 embryos processed per experimental group). Scale bar = 300 μm. (C) Cross-sections through the anterior (c1–c3) and posterior (c4–c6) pronephric duct of WT embryos treated as in (b1–b3) (n=2 experiments with an average of 23 pronephros sections processed per experimental group). Scale bar = 10 μm. (D) Lateral views of WT embryos exposed to 0 hr (d1) or 12 hr of anoxia (d2–d5) in presence or absence of MG-132 (100 μM, proteasome inhibitor), or Chloroquine (10 mM, autophagy inhibitor), or both and immunolabeled using anti-ATP1A1A. Annotation: yellow boxes show where anterior and posterior pronephric duct measurements were taken. Scale bar 200 μm. (E) Quantification of ATP1A1A fluorescence intensity in the pronephric duct of embryos subjected to the same anoxia and drug treatments as shown in (D). (Two-way ANOVA analysis was performed; Anterior PD: 7% increase in Anoxia 12 hr, mg132 vs Anoxia 12 hr, no drug p>0.9999 ns; 59% increase in Anoxia 12 hr, chloroquine vs Anoxia 12 hr, no drug p=0.0298 *; 87% increase in Anoxia 12 hr mg132 + chloroquine vs Anoxia 12 hr, no drug p=0.0013 **. Posterior PD: 24% increase in Anoxia 12 hr, mg132 vs Anoxia 12 hr, no drug p=0.0640 ns, 36% increase in Anoxia 12 hr, chloroquine vs Anoxia 12 hr, no drug p=0.0002 ***, 45% increase in Anoxia 12 hr mg132 + chloroquine vs Anoxia 12 hr, no drug p<0.0001 ****. (n=2 experiments, representative data shown for 1 experiment with an average of 14 pronephros segments processed per experimental group; Figure 5—source data 1). (F) Quantification of total ATP concentration per WT embryo or ndrg1a-/- mutant exposed to 0 (24 hpf or 27 hpf developmental stage control), 6, 12 hr of anoxia. No significant difference between WT and mutants were observed. Two-way ANOVA analysis was performed; 0 hr (24 hpf) WT vs. ndrg1a-/-: p-value = 0.9553, ns; 0 hr (27 hpf developmental stage control) WT vs. ndrg1a-/-: p value => 0.9999, ns; 6 h WT vs. ndrg1a-/-: p value => 0.9999, ns; 12 hr WT vs. ndrg1a-/-: p-value = 0.7652, ns). (n=5 experiments with an average of 15–20 embryos per experimental group; Figure 5—source data 2). (G) Quantification of total ATP concentration per WT embryo under anoxia either treated with or without 3 mM of ouabain. (Unpaired t test was performed; WT + Ouabain and Anoxia vs. WT + Anoxia only: p value =< 0.0001, ****; Figure 5—source data 3).