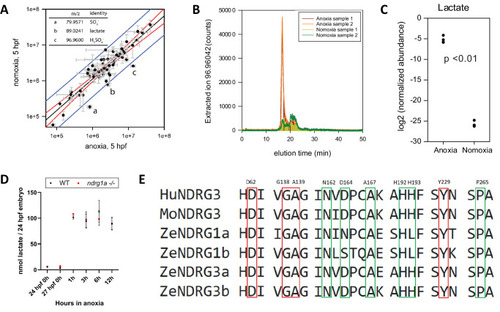
(A graph) Metabolites enriched in anoxia-treated embryos relative to normoxic controls. X axis: metabolite levels (integrated ion counts) in extracts from 5 hpf embryos exposed to 1 hr of anoxia; Y axis: metabolite levels (integrated ion counts) in extracts from age-matched 5 hpf normoxic controls. The red lines show the predicted correlation line (99% confidence). Blue lines demarcate outliers (99% confidence). Three potential outliers (a, b and c) were identified (n=10 embryos per sample and 2 technical repeats). (A, insert, top left) Identity of the three outliers (a–c) that are significantly enriched in the anoxia-treated sample. (B) Extracted ion counts for different elution timepoints are shown for two extracts from 5 hpf embryos exposed to 1 hr of anoxia (orange and red lines) and two control samples from 5 hpf normoxic embryos (yellow and green lines). The peak corresponds to lactate. (C) Comparison of lactate levels (highest peak intensity) in extracts from 5 hpf embryo exposed to 1 hr of anoxia and 5 hpf normoxic controls reveals an 18 fold increase (unpaired t test; p<0.01);Figure 6—source data 1A-C . (D) Fluorometric lactate assay quantification of total lactate concentration (in nmol lactate) per WT embryo or ndrg1a-/- mutant exposed to 0 (24 hpf or 27 hpf developmental stage control), 1, 3, 6, 12 hr of anoxia. No significant difference between WT and mutants were observed. Two-way ANOVA analysis was performed; 0 hr (24 hpf) WT vs. ndrg1a-/-: p value => 0.9999, ns; 0 hr (27 hpf developmental stage control) WT vs. ndrg1a-/-: p value => 0.9999, ns; 1 hr WT vs. ndrg1a-/-: p value => 0.9999, ns; 3 hr WT vs. ndrg1a-/-: p value => 0.9999, ns; 6 hr WT vs. ndrg1a-/-: p value = 0.9870, ns; 12 hr WT vs. ndrg1a-/-: p value => 0.9999, ns. (n=4 experiments with an average of 15 embryos per experimental group; Figure 6—source data 2). (E) Alignment of members of the NDRG family revealing lactate-docking residues, identified in NDRG3 by Lee et al., 2015. Green and red residues represent amino acids in NDRG3 that are 5 ångström from lactate. Red residues represent amino acids that may be critical for the interaction between NDRG3 and lactate.