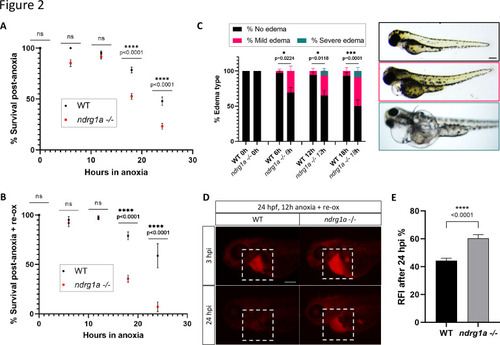
(A) % Survival of WT embryos and ndrg1a-/- mutants immediately following 6, 12, 18, and 24 hr of anoxia exposure. Embryos were 24 hpf at the time of exposure. A significant difference between WT and mutants was observed for 12 and 18 hr of anoxia (Two-way ANOVA analysis was performed; 0 hr WT vs. ndrg1a-/-: p-value > 0.9999, ns; 6 hr WT vs. ndrg1a-/-: p-value = 0.0793, ns; 12 hr WT vs. ndrg1a-/-: p-value = 0.9941, ns; 18 hr WT vs. ndrg1a-/-: p-value < 0.0001, ****; 24 hr WT vs. ndrg1a-/-: p-value < 0.0001, ****; n=5–8 experiments with an average of 171 embryos per experimental group; Figure 2—source data 1). (B) % Survival of WT embryos and ndrg1a-/-mutants following 6, 12, 18, and 24 hr of anoxia exposure and 2 days of re-oxygenation (re-ox). Embryos were 24 hpf at the time of initial anoxia exposure. A significant difference between WT and mutants was observed for 18 and 24 hr of anoxia + 2 re-ox (Two-way ANOVA analysis was performed; 0h+re ox WT vs. ndrg1a-/-: p-value > 0.9999, ns; 6 hr+re ox WT vs. ndrg1a-/-: p-value > 0.9999, ns; 12hr+re ox WT vs. ndrg1a-/-: p-value > 0.9999, ns; 18 hr+re ox WT vs. ndrg1a-/-: p-value < 0.0001, ****; 24 hr+re ox WT vs. ndrg1a-/-: p-value < 0.0001, ****; n=2–5 experiments with an average of 66 embryos per experimental group; Figure 2—source data 2). (C, left) % Edema observed in WT embryos and ndrg1a-/-mutants following 0, 6, 12, 18, and 24 hr of anoxia exposure and 2 days re-ox. Edema phenotypes were divided into three categories: no edema, mild edema and severe edema. A significant difference between WT and mutants was observed for 6, 12, and 18 hr of anoxia + 2 days re-ox for the presence of either mild or severe edema (Two-way ANOVA analysis was performed; 0 hr+re ox WT vs. ndrg1a-/-: p-value > 0.9999, ns; 6 hr+re ox WT vs. ndrg1a-/-: p-value = 0.0224, *; 12 hr+re ox WT vs. ndrg1a-/-: p-value = 0.0118, *; 18 hr+re ox WT vs. ndrg1a-/-: p-value = 0.0001, ***). (C, right) Representative images of embryos in each phenotypic category (n=2–3 experiments with an average of 36 embryos per experimental group; Figure 2—source data 3). Scale bar 200 μm. (D) Lateral views of injected embryos were taken 3 and 24 hr post-injection (hpi). White boxes indicate where fluorescence measurements were taken. Scale bar 200 μm. (E) Quantification of kidney clearance assay using 24 hpf WT embryos and ndrg1a-/-mutants exposed to 12 hr of anoxia, followed by 2 days re-ox and injection with rhodamine dextran. A significant difference between WT and mutants was observed 24 hpi (unpaired t test; p-value < 0.0001, ****). (n=2 experiments with an average of 18 embryos per experiment; Figure 2—source data 4).