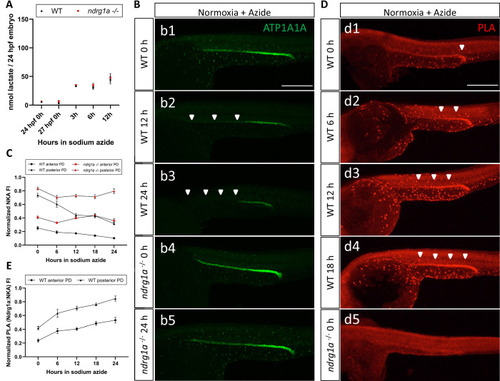
(A) Fluorometric lactate assay quantification of total lactate concentration (in nmol lactate) per WT embryo or ndrg1a-/- mutant exposed to 0 (24 hpf or 27 hpf developmental stage control), 3, 6, 12 hr of 300 uM of azide. No significant difference between WT and mutants were observed. Two-way ANOVA analysis was performed; 0 hr (24 hpf) WT vs. ndrg1a-/-: p value => 0.9999, ns; 0 hr (27 hpf developmental stage control) WT vs. ndrg1a-/-: p-value = 0.9994, ns; 3 hr WT vs. ndrg1a-/-: p value => 0.9999, ns; 6 hr WT vs. ndrg1a-/-: p-value = 0.9919, ns; 12 hr WT vs. ndrg1a-/-: p-value = 0.9986, ns. (n=4 experiments with an average of 15 embryos per experimental group; Figure 7—source data 1). (B) Lateral views of WT embryos and ndrg1a-/- mutants exposed at 24 hpf to increasing duration of azide under normoxia: (b1-5); 0 hr (b1, b4), 12hr (b2), 24 hr (b3, b5) and immunolabeled to reveal ATP1A1A. Arrowheads indicate decreased signal. (n=3 experiments with an average of 10 embryos processed per experimental group). Scale bar 300 μm. (C) Normalized NKA fluorescence intensity in the anterior (circle) and posterior (triangle) pronephric duct of WT (black) embryos and ndrg1a-/- (red) mutants. Embryos were exposed at 24 hpf to increasing duration of azide under normoxia (0, 6, 12, 18, and 24 hr) and immunolabeled to reveal ATP1A1A levels (n=2 experiments with an average of 19 pronephros segments processed per experimental group; Figure 7—source data 2). (D) Lateral views of WT embryos (d1-4) and an ndrg1a-/- mutant (d5) labeled using whole-mount proximity ligation assay (PLA) to reveal Ndrg1a and ATP1A1A interaction. Embryos were raised under normoxic conditions in the presence (6, 12, 18, 24 hr exposure) or absence of sodium azide. Annotations: arrowheads point to PLA signal (n=4 experiments with an average of 10 embryos processed per experimental group). Scale bar 300 μm. (E) Normalized PLA intensity in the anterior (circle) and posterior (triangle) pronephric duct of WT embryo. (n=2 experiments with an average of 16 pronephros segments processed per experimental group; Figure 7—source data 3).

