
- Title
-
Hypoplasia of dopaminergic neurons by hypoxia-induced neurotoxicity is associated with disrupted swimming development of larval zebrafish
- Authors
- Son, J.H., Gerenza, A.K., Bingener, G.M., Bonkowsky, J.L.
- Source
- Full text @ Front. Cell. Neurosci.
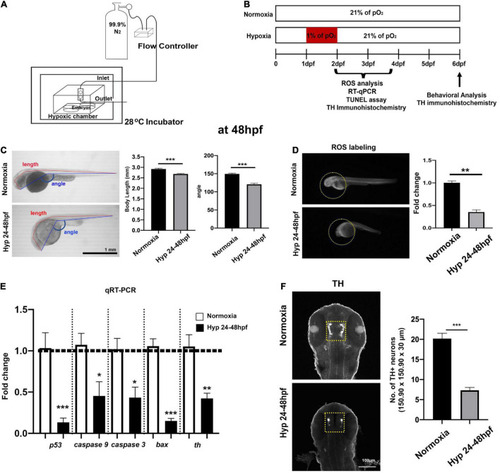
Experimental setup for developmental hypoxia and procedures and the effects of direct hypoxia (Hyp)-induced toxicity at 48 hpf. (A) A schematic diagram for the hypoxia setup, (B) the timeline for the experimental procedures, (C) the whole-body images of zebrafish for the comparison of body length (mm) and head-to-tail angle (HTA) in normoxia (n = 12) and hypoxia zebrafish (n = 12), (D) the ROS production/accumulation in zebrafish head analyzed with Student’s t-test and presented as fold changes in hypoxic zebrafish (n = 4) compared to controls (n = 5), (E) the expression of proapoptotic genes (p53, caspase9, caspase3, and bax) and tyrosine hydroxylase (Th) in hypoxic zebrafish (n = 6/group, triplicated) corresponding to the expression of reference gene (i.e., hatn10) analyzed with Student’s t-test and presented by percent changes compared to normoxic controls (n = 6/group, triplicated), and (F) Z-stack confocal images of normoxic and hypoxic zebrafish (ventral views, rostral to the top), anti-TH immunohistochemistry used to determine the number of TH+ neurons in the diencephalic area (150.90 μm × 150.90 μm × 30 μm) in hypoxic zebrafish (n = 12) compared to normoxic controls (n = 12). For this and in subsequent figures, data are shown as mean ± SEM unless otherwise noted and statistically analyzed with Student’s t-test. *p < 0.05, **p < 0.01, and ***p < 0.001. |

The indirect “catch-up” response to hypoxia (i.e., HR) at 96 hpf following hypoxia. (A) The Z-stack confocal images (ventral views, rostral to the top) were used to determine the maximum intensity projections and the number of TH+ neurons in the diencephalic area (170.22 μm × 170.22 μm × 30 μm) in normoxic (n = 11) and HR zebrafish (n = 12) analyzed with Student’s t-test and shown as Means ± SEM, (B) the ROS production/accumulation in zebrafish head analyzed with Student’s t-test and presented as fold changes in HR zebrafish (n = 5) compared to controls (n = 5), (C) the expression of proapoptotic genes (p53, caspase9, caspase3, and bax) and tyrosine hydroxylase (th) in normoxic and HR zebrafish (n = 6/group, triplicated) corresponding to the expression of reference gene (hatn10) analyzed with Student’s t-test and presented by percent changes compared to normoxic controls (n = 6/group, triplicated), (D) the magnified TH+, TUNEL+, and merged TH+/TUNEL+ images and arrows indicate TUNEL+ and TH+ neurons. The TUNEL labeling in green and anti-TH in red (174.22 μm × 174.22 μm × 30 μm) in HR zebrafish (n = 11) compared to normoxic zebrafish larvae (n = 12). *p < 0.05, **p < 0.01, and ***p < 0.001. |

(A) A schematic drawing (left, top panel) and Z-stack confocal image (left, bottom panel) of diencephalic TH+ DA neurons at 5 dpf, including in DC1, DC2, DC3, DC4/5, and DC6. (A) Z-stack confocal images of the anti-TH immunohistochemistry were analyzed in the DC4/5 and DC 6 areas (180.11 μm × 180.11 μm × 20 μm) in HR zebrafish (n = 23) compared to normoxic controls (n = 20) analyzed with Student’s t-test and presented as Means ± SEM. ***p < 0.001. (B) Developmental hypoxia results in disrupted swimming maturation at 6 dpf. Data plots (Means ± SEM) show the averaged swimming distance, velocity, and frequency of movements n the dark (3 × 10 min) and in light (3 × 10 min) in HR larvae (n = 24) compared to normoxic controls (n = 24). Student’s t-test, ***p < 0.001, and *p < 0.05. (C) Developmental hypoxia causes reduced swimming distance in dark in 1.5-month-old young zebrafish (hypoxia, n = 6 vs. normoxia, n = 6). ***p < 0.001, *p < 0.05. |
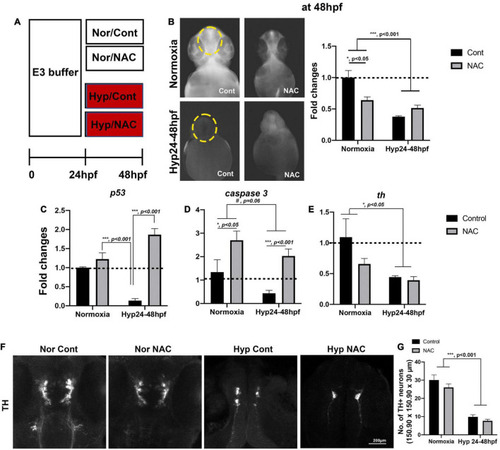
(A) A schematic diagram for NAC treatment procedures with normoxia (Nor) and hypoxia (Hyp) and the effects of NAC vs. control (Cont) against direct-hypoxic injury at 48 hpf. (B) ROS production/accumulation in zebrafish head at 48 hpf in normoxic zebrafish with control (n = 6), normoxic zebrafish with NAC (n = 6), hypoxic zebrafish with control (n = 3), and hypoxic zebrafish with NAC (n = 5) analyzed by two-way ANOVA followed by Tukey’s post hoc test and presented as fold change compared to normoxic control. (C–E) Different expression of proapoptotic genes (p53, caspase9, caspase3, and bax) by HR, including normoxic control (n = 6/group, triplicated) and normoxic NAC (n = 6/group, triplicated), hypoxic control (n = 6/group, triplicated), and hypoxic NAC (n = 6/group, triplicated) analyzed by two-way ANOVA followed by Tukey’s post hoc test and presented by percent changes. (F) The Z-stack, confocal images, and (G) corresponding cell counts of anti-TH at 48 hpf (150.90 μm × 150.90 μm × 30 μm) in normoxic control (n = 5), normoxic NAC (n = 6), and hypoxic control (n = 5), and hypoxic NAC (n = 6) analyzed by two-way ANOVA followed by Tukey’s post hoc test and presented by Means ± SEM. *p < 0.05, ***p < 0.001, and #p = 0.06. |

(A) A schematic diagram for NAC treatment procedures by HR and the effects of NAC with reoxygenation against the hypoxic injury with HR 96 hpf. (B) ROS production/accumulation in zebrafish head at 96 hpf in normoxic control (n = 16), normoxic NAC (n = 17), HR control (n = 14), and HR NAC (n = 14) analyzed by two-way ANOVA followed by Tukey’s post hoc test and presented fold changes compared to normoxic control. (C–E) Different expression of proapoptotic genes (p53, caspase9, caspase3, and bax) by HR, including HR NAC (n = 6/group, triplicated) and HR control (n = 6/group, triplicated), normoxic NAC (n = 6/group, triplicated), and normoxic control (n = 6/group, triplicated) analyzed by two-way ANOVA followed by Tukey’s post hoc test and presented by percent changes. (F) The Z-stack, confocal images of TUNEL+ and the number of (G) anti-TH, (H) TUNEL+, and (I) anti-TH/TUNEL+ at 96 hpf (174.22 μm × 174.22 μm × 30 μm3) in normoxic control (n = 5), normoxic NAC (n = 6), and HR control (n = 5), and HR NAC (n = 6) analyzed by two-way ANOVA followed by Tukey’s post hoc test. *p < 0.05, **p < 0.01, and ***p < 0.001. |
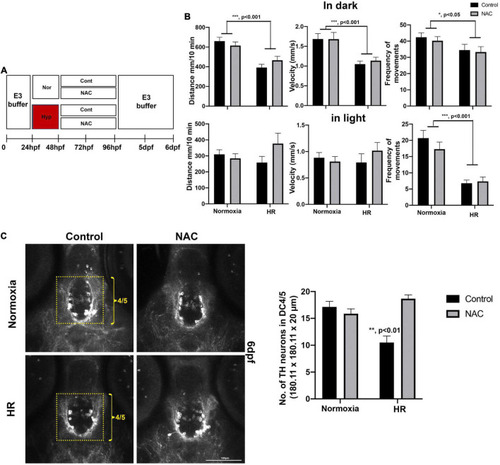
(A) A schematic diagram for NAC treatment procedures with HR and the effects of NAC on swimming development and DC4/5 TH+ neurons at 6 dpf. (B) Behavioral data in normoxic control (n = 72), in normoxic NAC (n = 70), HR control (n = 51), and HR NAC (n = 64) were analyzed by two-way ANOVA followed by Tukey’s post hoc test. (C) The Z-stack, confocal images of anti-TH at 6 dpf in the DC4/5 area (180.11 μm × 180.11 μm × 20 μm) in normoxic control (n = 6), normoxic NAC (n = 8), and HR control (n = 6), and HR NAC (n = 12) analyzed by two-way ANOVA followed by Tukey’s post hoc test. *p < 0.05, **p < 0.01, and ***p < 0.001. |