
FIGURE 1
- ID
- ZDB-FIG-221018-152
- Publication
- Son et al., 2022 - Hypoplasia of dopaminergic neurons by hypoxia-induced neurotoxicity is associated with disrupted swimming development of larval zebrafish
- Other Figures
- All Figure Page
- Back to All Figure Page
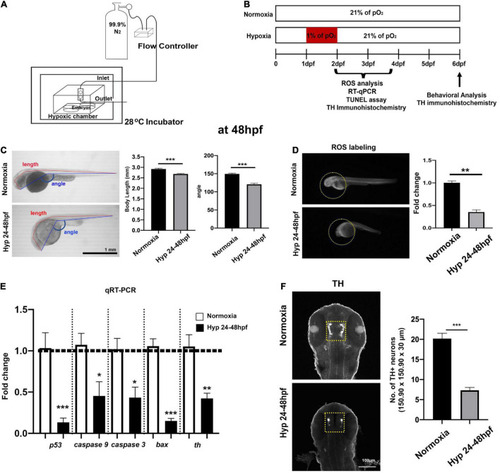
Experimental setup for developmental hypoxia and procedures and the effects of direct hypoxia (Hyp)-induced toxicity at 48 hpf. (A) A schematic diagram for the hypoxia setup, (B) the timeline for the experimental procedures, (C) the whole-body images of zebrafish for the comparison of body length (mm) and head-to-tail angle (HTA) in normoxia (n = 12) and hypoxia zebrafish (n = 12), (D) the ROS production/accumulation in zebrafish head analyzed with Student’s t-test and presented as fold changes in hypoxic zebrafish (n = 4) compared to controls (n = 5), (E) the expression of proapoptotic genes (p53, caspase9, caspase3, and bax) and tyrosine hydroxylase (Th) in hypoxic zebrafish (n = 6/group, triplicated) corresponding to the expression of reference gene (i.e., hatn10) analyzed with Student’s t-test and presented by percent changes compared to normoxic controls (n = 6/group, triplicated), and (F) Z-stack confocal images of normoxic and hypoxic zebrafish (ventral views, rostral to the top), anti-TH immunohistochemistry used to determine the number of TH+ neurons in the diencephalic area (150.90 μm × 150.90 μm × 30 μm) in hypoxic zebrafish (n = 12) compared to normoxic controls (n = 12). For this and in subsequent figures, data are shown as mean ± SEM unless otherwise noted and statistically analyzed with Student’s t-test. *p < 0.05, **p < 0.01, and ***p < 0.001. |