
FIGURE 6
- ID
- ZDB-IMAGE-221018-159
- Publication
- Son et al., 2022 - Hypoplasia of dopaminergic neurons by hypoxia-induced neurotoxicity is associated with disrupted swimming development of larval zebrafish
- All Figures
- Figures for Son et al., 2022
|
FIGURE 6
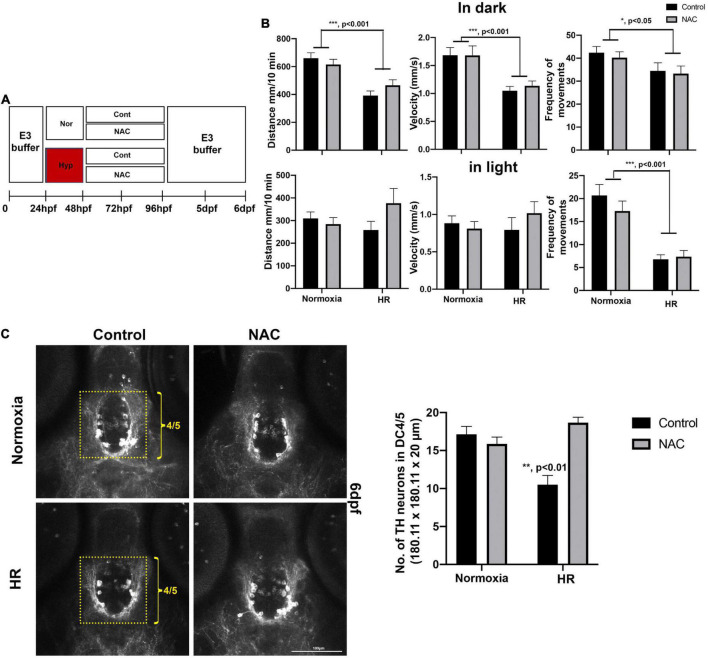
(A) A schematic diagram for NAC treatment procedures with HR and the effects of NAC on swimming development and DC4/5 TH+ neurons at 6 dpf. (B) Behavioral data in normoxic control (n = 72), in normoxic NAC (n = 70), HR control (n = 51), and HR NAC (n = 64) were analyzed by two-way ANOVA followed by Tukey’s post hoc test. (C) The Z-stack, confocal images of anti-TH at 6 dpf in the DC4/5 area (180.11 μm × 180.11 μm × 20 μm) in normoxic control (n = 6), normoxic NAC (n = 8), and HR control (n = 6), and HR NAC (n = 12) analyzed by two-way ANOVA followed by Tukey’s post hoc test. *p < 0.05, **p < 0.01, and ***p < 0.001.