
FIGURE 2
- ID
- ZDB-IMAGE-221018-154
- Publication
- Son et al., 2022 - Hypoplasia of dopaminergic neurons by hypoxia-induced neurotoxicity is associated with disrupted swimming development of larval zebrafish
- All Figures
- Figures for Son et al., 2022
|
FIGURE 2
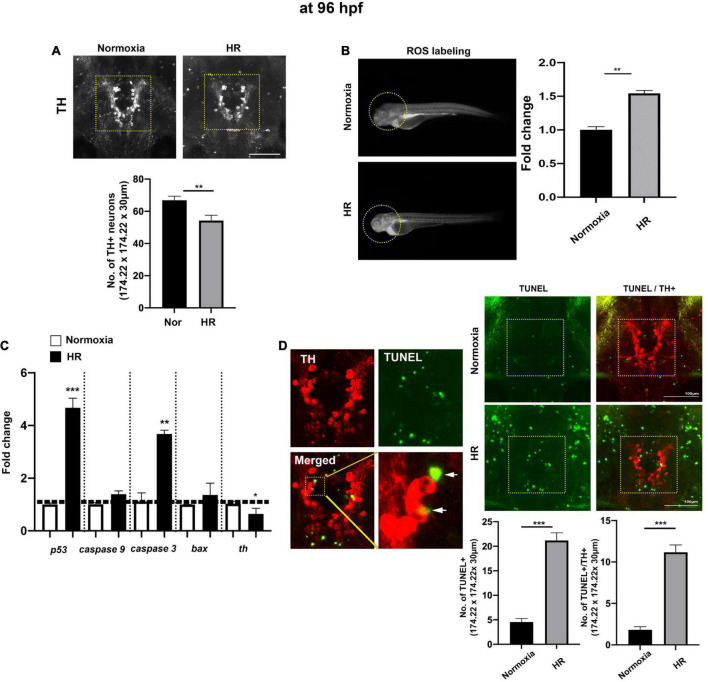
The indirect “catch-up” response to hypoxia (i.e., HR) at 96 hpf following hypoxia. (A) The Z-stack confocal images (ventral views, rostral to the top) were used to determine the maximum intensity projections and the number of TH+ neurons in the diencephalic area (170.22 μm × 170.22 μm × 30 μm) in normoxic (n = 11) and HR zebrafish (n = 12) analyzed with Student’s t-test and shown as Means ± SEM, (B) the ROS production/accumulation in zebrafish head analyzed with Student’s t-test and presented as fold changes in HR zebrafish (n = 5) compared to controls (n = 5), (C) the expression of proapoptotic genes (p53, caspase9, caspase3, and bax) and tyrosine hydroxylase (th) in normoxic and HR zebrafish (n = 6/group, triplicated) corresponding to the expression of reference gene (hatn10) analyzed with Student’s t-test and presented by percent changes compared to normoxic controls (n = 6/group, triplicated), (D) the magnified TH+, TUNEL+, and merged TH+/TUNEL+ images and arrows indicate TUNEL+ and TH+ neurons. The TUNEL labeling in green and anti-TH in red (174.22 μm × 174.22 μm × 30 μm) in HR zebrafish (n = 11) compared to normoxic zebrafish larvae (n = 12). *p < 0.05, **p < 0.01, and ***p < 0.001.