
FIGURE 4
- ID
- ZDB-IMAGE-221018-156
- Publication
- Son et al., 2022 - Hypoplasia of dopaminergic neurons by hypoxia-induced neurotoxicity is associated with disrupted swimming development of larval zebrafish
- All Figures
- Figures for Son et al., 2022
|
FIGURE 4
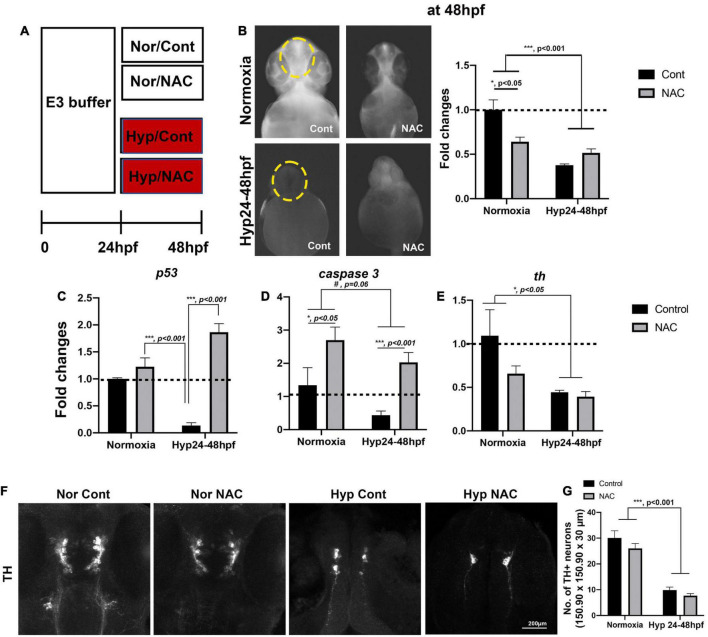
(A) A schematic diagram for NAC treatment procedures with normoxia (Nor) and hypoxia (Hyp) and the effects of NAC vs. control (Cont) against direct-hypoxic injury at 48 hpf. (B) ROS production/accumulation in zebrafish head at 48 hpf in normoxic zebrafish with control (n = 6), normoxic zebrafish with NAC (n = 6), hypoxic zebrafish with control (n = 3), and hypoxic zebrafish with NAC (n = 5) analyzed by two-way ANOVA followed by Tukey’s post hoc test and presented as fold change compared to normoxic control. (C–E) Different expression of proapoptotic genes (p53, caspase9, caspase3, and bax) by HR, including normoxic control (n = 6/group, triplicated) and normoxic NAC (n = 6/group, triplicated), hypoxic control (n = 6/group, triplicated), and hypoxic NAC (n = 6/group, triplicated) analyzed by two-way ANOVA followed by Tukey’s post hoc test and presented by percent changes. (F) The Z-stack, confocal images, and (G) corresponding cell counts of anti-TH at 48 hpf (150.90 μm × 150.90 μm × 30 μm) in normoxic control (n = 5), normoxic NAC (n = 6), and hypoxic control (n = 5), and hypoxic NAC (n = 6) analyzed by two-way ANOVA followed by Tukey’s post hoc test and presented by Means ± SEM. *p < 0.05, ***p < 0.001, and #p = 0.06.