
- Title
-
Microtubules are not required to generate a nascent axon in embryonic spinal neurons in vivo
- Authors
- Moore, R.E., Pop, S., Alleyne, C., Clarke, J.D.W.
- Source
- Full text @ EMBO Rep.

A. Diagram to illustrate the three different views shown in confocal images and 3D reconstructions throughout this paper, plus legend for arrows and asterisk. B. Image sequence from confocal time lapse shows the early steps in neuronal differentiation. Two transient basal protrusions are extended along the basal surface of the neural tube (6 h 26 min to 14 h 01 min) and then retracted (15 h 31 min to 17 h 31 min). The apical attachment is also retracted (17 h 31 min to 19 h 53 min; e.g. ?1 h 30 min) before the axon is extended (20 h 38 min to 21 h 50 min). Main images are maximum projections and insets are transverse reconstructions from confocal z-stacks. C. Image sequence from confocal time lapse shows a neuron before, during and after axon initiation. Prior to axon initiation, the neuron extends multiple small, transient preaxonal protrusions (?2 h to ?20 min). The nascent axon is extended (0 h) and maintained for a short period (0 h to 30 min) before axon growth begins (45 min to 2 h 20 min). Images are transverse reconstructions from confocal z-stacks. D. Plots showing axon position on the soma (e.g. asterisk in Fig 1C: 0 h) relative to the cell centroid at 0,0 for dorsal and transverse views (n = 86 cells from 8 experiments). Axon position is not random (dorsal view P < 0.001, mean = 95.3o; transverse view P < 0.001, mean = 148.9o). Data analysed using Moore's modification of the Rayleigh's test. E. Diagram showing neuronal subtypes in the zebrafish embryo's spinal cord. CiA, circumferential ascending; CiD, circumferential descending; CoB, commissural bifurcating; CoPA, commissural primary ascending; CoSA, commissural secondary ascending; DLF, dorsal longitudinal fasciculus; DoLA, dorsolateral ascending; M, motor; MLF, medial longitudinal fasciculus; RB, Rohon-Beard; UCoD, unilateral commissural descending; VeLD, ventral longitudinal descending; VLF, ventral longitudinal fasciculus. F. Lateral and transverse reconstructions of DoLA neurons at the time of axon initiation (0 h) and during axon growth (4 h). G?M. Plots showing axon position on the soma relative to cell centroid at 0,0 in dorsal and transverse views for DoLA (G; n = 7 cells), CiA (H; n = 10 cells), CiD (I; n = 3 cells), VeLD (J; n = 5 cells), CoSA (K; n = 11 cells), CoB (L; n = 6 cells) and UCoD (M; 15 cells) neuronal subtypes. Data information: All scale bars = 10 ?m. Source data are available online for this figure. |

A. Image sequence showing the centrosome position of a neuron labelled with membrane and centrosome labels during apical process retraction. The centrosome is retracted close to the tip of the apical process. Images are maximum projections from confocal z-stacks. B. (i) Image sequence showing a neuron labelled with a membrane marker during apical retraction without any observable abscission event (n = 64/72 cells from 6 experiments). (ii) High-resolution images of boxed section in (i). Images are maximum projections from confocal z-stacks.< C. (i) Low magnification overview of the spinal cord of a cilium reporter line, Tg(actb2:arl13b-GFP) from a single confocal slice. (ii) High-resolution image sequence of boxed section in (i). One GFP-labelled cilium moves from apical surface towards the basal surface of the spinal cord (n = 13 cilia from two experiments). Images are maximum projections from confocal z-stacks. D. (i) Low magnification overview of the spinal cord of a Tg(actb2:arl13b-GFP) embryo labelled with centrin-RFP from a single confocal slice. (ii) Image sequence of boxed section in (i). A cilium and centrosome move together from apical surface towards the basal surface of the spinal cord (n = 2 cells from one experiment). Insets show high magnification of cilium-centrosome pair. Images are maximum projections from confocal z-stacks. E. Graph showing the length of cilium as it moves from apical surface (0%) to close to the basal surface (100%. Cilium length did not change; P > 0.05 for n = 6/7 cilia from two experiments; nonlinear regression). F. Distance between centrosome and cilium in Tg(actb2:arl13b-GFP) embryos fixed and processed for immunohistochemistry against GFP to label the cilium and ?-tubulin to label the centrosome. No difference was found in the distance between the two organelles when close to the apical surface or away from the midline (n = 50 cells per position from two experiments; P = 0.8279; midline mean = 0.4956, s.d. = 0.1125; away from midline mean = 0.5004, s.d. = 0.1077; Student's unpaired t-test). Bars show mean and standard deviation. Data information: All scale bars = 10 ?m. Source data are available online for this figure. |
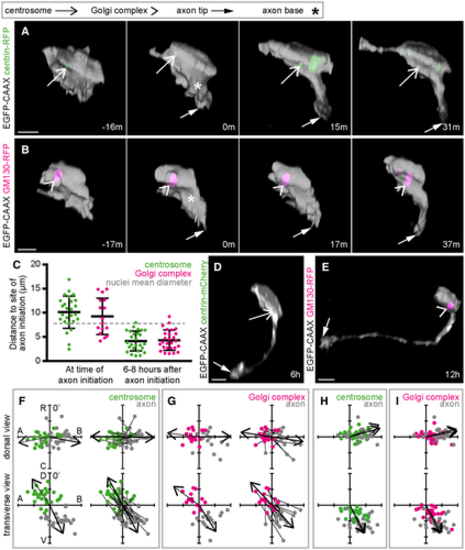
A. Image sequence from confocal time lapse shows a neuron labelled with membrane and centrosome markers before (?16 m), during (0 m) and after axon initiation (15 m, 31 m). The centrosome is located on the opposite side of the cell to the nascent axon. Images are transverse reconstructions from confocal z-stacks. B. Image sequence from confocal time lapse shows a neuron labelled with membrane and Golgi complex markers before (?17 m), during (0 m) and after axon initiation (17 m, 37 m). The Golgi complex is located on the opposite side of the cell to the nascent axon. Images are transverse reconstructions from confocal z-stacks. C. Graph showing distance between centrosome or Golgi complex and base of axon at time of axon initiation and 6?8 h after axon initiation. Bars show mean and standard deviation. At time of axon initiation: centrosome-axon mean = 10.1 ?m, s.d. = 3.3, n = 26 cells from three experiments; Golgi complex-axon mean = 9.3 ?m, s.d. = 3.8, n = 16 cells from two experiments. At 6?8 h after axon initiation: centrosome-axon mean = 4.2 ?m, s.d. = 2.1, n = 26 cells; Golgi complex-axon mean = 4.3 ?m, s.d. = 2.1, n = 27 cells. D. Transverse reconstruction from confocal time lapse of a neuron labelled with membrane and centrosome markers during axon growth. E. Transverse reconstruction from confocal time lapse of a neuron labelled with membrane and Golgi complex markers during axon growth. F. Plots showing the positions of the centrosome and base of the axon at the time of axon initiation relative to the cell centroid at 0,0 for dorsal and transverse views (n = 26 cells from three experiments). Left-hand plots: centrosome position is not random (dorsal view P < 0.001, mean = ?100.8o; transverse view P < 0.001, mean = ?33.7o) and axon position is not random (dorsal view P < 0.001, mean = 101.0o; transverse view P < 0.001, mean = 154.8o; Moore's modification of the Rayleigh's test). Centrosome and axon positions are significantly different (dorsal view 0.001 > P; transverse view 0.001 > P; Moore's test for paired data). Right-hand plots: vectors linking centrosome and nascent axon of the same cell are not random (dorsal view P < 0.001, mean = 91.0o; transverse view P < 0.001, mean = 151.7o; Moore's modification of the Rayleigh's test). G. Plots showing the positions of the Golgi complex (magenta) and base of the axon (grey) at the time of axon initiation relative to the cell centroid at 0,0 for dorsal and transverse views (n = 16 cells from two experiments). Left-hand plots: Golgi complex position is not random (dorsal view 0.01 < P < 0.05, mean = ?83.0o; transverse view P < 0.001, mean = ?53.4o) and axon position is not random (dorsal view P < 0.001, mean = 89.1o; transverse view P < 0.001, mean = 147.4o; Moore's modification of the Rayleigh's test). Golgi complex and axon positions are significantly different (dorsal view 0.001 > P; transverse view 0.001 > P; Moore's test for paired data). Right-hand plots: vectors linking Golgi complex and nascent axon of the same cell are not random (dorsal view P < 0.001, mean = 98.5o; transverse view P < 0.001, mean = 156.8o; Moore's modification of the Rayleigh's test). H. Plots showing the positions of the centrosome and base of the axon 6?12 h after axon initiation relative to the cell centroid at 0,0 for dorsal and transverse views (n = 26 cells). Centrosome position is not random (dorsal view P < 0.001, mean = 67.7o; transverse view P < 0.001, mean = 151.6o). Axon position is not random (dorsal view P < 0.001, mean = 74.0o; transverse view P < 0.001, mean = 153.7o; Moore's modification of the Rayleigh's test). Centrosome and axon positions are not significantly different (dorsal view 0.5 < P; transverse view 0.1 < P < 0.5; Moore's test for paired data). I. Plots showing the positions of the Golgi complex and base of the axon 6?12 h after axon initiation relative to the cell centroid at 0,0 for dorsal and transverse views (n = 27 cells). Golgi complex position is not random (dorsal view P < 0.001, mean = 79.9o; transverse view P < 0.001, mean = 149.9o). Axon position is not random (dorsal view P < 0.001, mean = 76.0o; transverse view P < 0.001, mean = 153.9o; Moore's modification of the Rayleigh's test). Golgi complex and axon positions are different only in transverse view (dorsal view 0.5 < P; transverse view 0.005 < P < 0.01; Moore's test for paired data). Data information: All scale bars = 10 ?m. Source data are available online for this figure. |
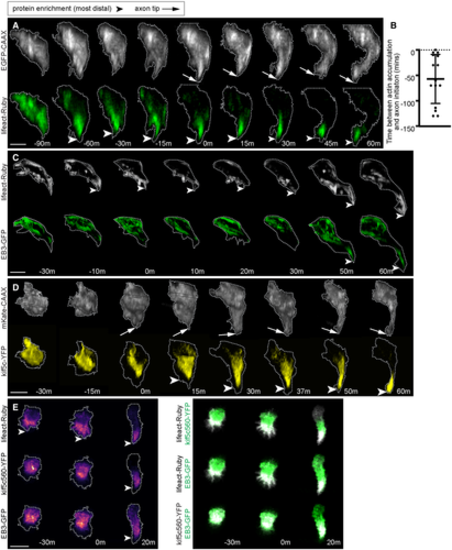
A. Image sequence from confocal time lapse of a neuron labelled with a membrane marker and lifeact-Ruby before, during (0 m) and after axon initiation. Images are transverse reconstructions from confocal z-stacks. B. Graph showing time (minutes) between actin accumulation and nascent axon initiation (n = 15 cells from 7 experiments). Bars show mean and standard deviation. C. Image sequence from confocal time lapse of a neuron labelled with lifeact-Ruby and EB3-GFP before, during (0 m) and after axon initiation. Images are transverse reconstructions from confocal z-stacks. D. Image sequence from confocal time lapse of a neuron labelled with a membrane marker and Kif5c560-YFP before, during (0 m) and after axon initiation. Images are transverse reconstructions from confocal z-stacks. E. Three time points from confocal time lapse of a triple labelled neuron before, during (0 m) and after nascent axon initiation. Images to left show the distribution sequence of lifeact-Ruby, kif5c560-YFP and EB3-GFP individually. Dual channel merges to the right show relative locations of pairs of fusion proteins. Images to right are maximum projections of transverse reslices of confocal z-stacks. Data information: All scale bars = 10 ?m. Source data are available online for this figure. |

A. Image sequence from confocal time lapse of a neuron that does not extend a nascent axon during nocodazole treatment labelled with a membrane marker and lifeact-Ruby before (?10 m) and during (0 m to 170 m) nocodazole treatment. Protrusions present before nocodazole addition are retracted upon nocodazole treatment (20 m). Short, transient nonaxonal protrusions are extended during nocodazole treatment. Images are transverse reconstructions from confocal z-stacks. B. Image sequence from confocal time lapse of a neuron that extends a nascent axon during nocodazole treatment labelled with a membrane marker and lifeact-Ruby before (?10 m) and during (0 h to 170 min) nocodazole treatment. Small protrusions present before nocodazole addition (?10 m) are retracted upon nocodazole treatment (0 m). A nascent axon-like protrusion (long, broad, long-lived) is extended during nocodazole treatment (110 m to 170 m). Transient nonaxonal protrusions are also present. Images are transverse reconstructions from confocal z-stacks. B. Graph showing duration (minutes) of nascent axon-like protrusions in nocodazole-treated cells and nonaxonal protrusions in control and nocodazole-treated cells. Control nascent axons were not analysed as they do not retract. Bars show mean and standard deviation. Nocodazole nascent axons: n = 14 protrusions from 14 cells from three experiments; mean = 65.17 min, s.d. = 20.33. Control nonaxons: n = 40 protrusions from 10 cells from three experiments; mean = 17.15 min, s.d. = 8.804. Nocodazole nonaxons: n = 41 protrusions from 16 cells from three experiments; mean = 16.182 min, s.d. = 7.147. One-way ANOVA with multiple comparisons: P < 0.0001; nocodazole nascent axon vs nocodazole nonaxon P < 0.0001; control nonaxon vs nocodazole nonaxon P = 0.9132. C. Graph showing length (?m) of nascent axon-like protrusions and nonaxonal protrusions in control and nocodazole-treated cells. Bars show mean and standard deviation. Control nascent axons were analysed after 60 min: n = 18 protrusions from 18 cells; mean = 14.092 ?m, s.d. = 5.149. Nocodazole nascent axons: n = 14 protrusions from 14 cells; mean = 9.596 ?m, s.d. = 2.371. Control nonaxons: n = 40 protrusions from 10 cells; mean = 5.802 ?m, s.d. = 2.553. Nocodazole nonaxons: n = 41 protrusion from 16 cells; mean = 4.407 ?m, s.d. = 2.024. One-way ANOVA with multiple comparisons: P < 0.0001; control nascent axon vs nocodazole nascent axon P = 0.0002; control nascent axon vs control nonaxon P < 0.0001; nocodazole nascent axon vs nocodazole nonaxon P < 0.0001; control nonaxon vs. nocodazole nonaxon P = 0.1485. D. Graph showing width (?m) at the base of nascent axon-like protrusions and nonaxonal protrusions in control and nocodazole-treated cells. Bars show mean and standard deviation. Control nascent axons: n = 19 protrusions from 19 cells from six experiments; mean = 7.806 ?m, s.d. = 3.163. Nocodazole nascent axons: n = 14 protrusions from 14 cells from three experiments; mean = 4.188 ?m, s.d. = 1.637. Control nonaxons from three experiments: n = 40 protrusions from 10 cells; mean = 1.061 ?m, s.d. = 0.652. Nocodazole nonaxons from three experiments: n = 41 protrusions from 16 cells; mean = 0.984 ?m, s.d. = 0.757. One-way ANOVA with multiple comparisons: P < 0.0001; control nascent axon vs nocodazole nascent axon P < 0.0001; control nascent axon vs control nonaxon P < 0.0001; nocodazole nascent axon vs nocodazole nonaxon P < 0.0001; control nonaxon vs nocodazole nonaxon P = 0.9958. F. Plots showing nascent axon position on the soma of control cells relative to the cell centroid at 0,0 for dorsal and transverse views (n = 19 cells from six experiments). Numbers show total count of axons in each quadrant. G. Plots showing nascent axon position on the soma of nocodazole-treated cells relative to the cell centroid at 0,0 for dorsal and transverse views (n = 14 cells from three experiments). Numbers show total count of axons in each quadrant. H. Plots showing the position of nonaxonal protrusions on the soma of control cells relative to the cell centroid at 0,0 for dorsal and transverse views (n = 40 protrusions from 10 cells from three experiments). Numbers show total count of protrusions in each quadrant. I. Plots showing the position of nonaxonal protrusions on the soma of nocodazole-treated cells relative to the cell centroid at 0,0 for dorsal and transverse views (n = 41 protrusions from 16 cells from three experiments). Numbers show total count of protrusions originating in each quadrant. J. Graph showing the ratio of kif5c560-YFP fluorescence intensity in the soma compared to the axon with or without nocodazole. Bars show mean and standard deviation. Control: n = 6 cells from four experiments; mean = 1.81, s.d. = 1.59. Nocodazole: n = 7 cells from four experiments; mean = 0.75, s.d. = 0.19. K. Image sequence from confocal time lapse of a neuron that extends a nascent axon during nocodazole treatment labelled with a membrane marker and kif5c560-YFP before (?10 m) and during (0 h to 144 min) nocodazole treatment. A nascent axon-like protrusion is extended during nocodazole treatment (92 m to 144 m), but kif5c560-YFP does not accumulate there. Images are transverse reconstructions from confocal z-stacks. Data information: All scale bars = 10 ?m. ***P < 0.001. ****P < 0.0001. Source data are available online for this figure. |
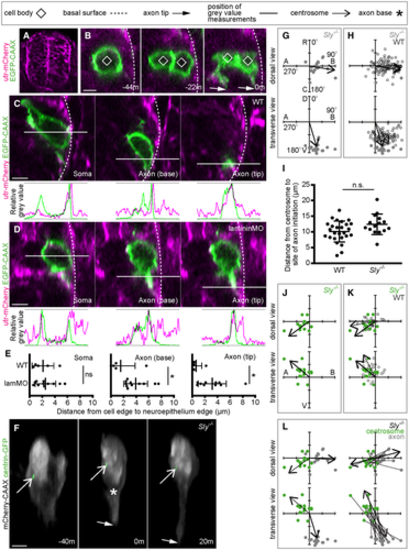
A. Transverse section from a confocal z-stack showing the whole neural tube of a utr-mCherry embryo, showing localisation to the basal surface. B. Transverse sections from a confocal z-stack of a nonapical progenitor labelled with a membrane marker in a utr-mCherry embryo to identify the basal surface of the spinal cord. Image sequence from confocal time lapse shows the nonapical progenitor (?44 m) undergoing mitosis to produce two neurons (?22 m), of which one is not in contact with the basal surface. Both neurons extend nascent axons (0 m). C. Transverse sections from a confocal z-stack of a neuron at the time of nascent axon initiation labelled with a membrane marker in a utr-mCherry embryo to identify the basal surface of the spinal cord. Three different sections show the middle of the soma, the axon initiation site and the axon tip. Green and magenta peaks in graphs show relative positions of cell membrane and basal surface, respectively. D. Transverse sections from confocal z-stacks of a neuron at the time of nascent axon initiation labelled with a membrane marker in a utr-mCherry embryo injected with lamMO. Three different sections show the middle of the soma, the axon initiation site and the axon tip. Green and magenta peaks in graphs show relative positions of cell membrane and basal surface, respectively. E. Graphs showing the distance (?m) between the basal edge of the soma, the axon initiation site or the axon tip and the basal surface of the spinal cord. Measurements were performed by measuring between basal-most green and magenta peaks in graphs of relative grey values (C, D). Bars show mean and standard deviation. WT: n = 5 cells from one experiment; lamMO: n = 11 cells from two experiments. Soma: WT mean = 2.007 ?m, s.d. = 1.055; lamMO mean = 1.871 ?m, s.d. = 1.830. Student's two-tailed test, P = 0.880. Axon initiation site: WT mean = 1.366 ?m, s.d. = 3.13; lamMO mean = 2.353 ?m, s.d. = 2.125. Student's two-tailed test, P = 0.468. Axon tip: WT mean = 0.637 ?m, s.d. = 1.078; lamMO mean = 2.903 ?m, s.d. = 2.0433. Student's two-tailed test, P = 0.037. F. Image sequence from confocal time lapse shows a neuron in a Sly?/? embryo labelled with membrane and centrosome markers before (?40 m), during (0) and after axon initiation (20 m). Images are transverse reconstructions from confocal z-stacks. G. Plots showing axon position on the soma relative to the cell centroid at 0,0 for dorsal and transverse views in Sly?/? embryos (n = 18 cells from three experiments). Axon position is not random (dorsal view P < 0.001, mean = 98.8o; transverse view P < 0.001, mean = 161.1o; Moore's modification of the Rayleigh's test). H. Plots showing merge of WT and Sly?/? axon positions on the cell body relative to cell centroid at 0,0 for dorsal and transverse views. Axon positions in WT and Sly?/? are not significantly different in dorsal view (0.2 < P < 0.5) but are in the transverse view (P < 0.001; Batschelet's alternative to the Hotelling test). WT: n = 86 cells from eight experiments; Sly?/?: n = 18 cells from three experiments. I. Graph showing the distance between centrosome and base of axon at time of axon initiation in WT and Sly?/? embryos. Bars show mean and standard deviation. WT: n = 26 cells from three experiments, mean = 10.13 ?m, s.d. = 3.35. Sly?/?: n = 15 cells from two experiments, mean = 12.41 ?m, s.d. = 3.281. One-way ANOVA, P = 0.123. J. Plots showing centrosome position relative to the cell centroid at 0,0 for dorsal and transverse views in Sly?/? embryos (n = 15 cells from two experiments). Centrosome position is not random (dorsal view P < 0.001, mean = ?129.0o; transverse view 0.001 < P < 0.005, mean = ?57.0o; Moore's modification of the Rayleigh's test). K. Plots showing merge of WT and Sly?/? centrosome positions on the cell body relative to cell centroid at 0,0 for dorsal and transverse views. Centrosome positions are not significantly different between WT and Sly?/? (dorsal view P > 0.2, transverse view 0.1 < P < 0.2; Batschelet's alternative to the Hotelling test). WT: n = 26 cells from three experiments; Sly?/?: n = 15 cells from two experiments. L. Plots showing the positions of the centrosome and base of the axon in Sly?/? embryos at the time of axon initiation relative to the cell centroid at 0,0 for dorsal and transverse views (n = 15 cells from two experiments). Left-hand plots: centrosome position is not random (dorsal view P < 0.001, mean = ?129.0o; transverse view P < 0.001, mean = ?57.0) and axon position is not random (dorsal view P < 0.001, mean = 95.1o; transverse view P < 0.001, mean = 168.8o, Moore's modification of the Rayleigh's test). Centrosome and axon positions are significantly different (dorsal view 0.001 > P; transverse view 0.001 > P; Moore's test for paired data). Right-hand plots: vectors connecting centrosome and nascent axon from the same cell are not random (dorsal view P < 0.001, mean = 66.1o; transverse view P < 0.001, mean = 150.9o). Data information: All scale bars = 5 ?m. *P < 0.05. Source data are available online for this figure. |

Graphs showing the maximum protrusion length from ten cells from four experiments before, during (0 min) and after axon initiation. Length is shown relative to length at the time of axon initiation (0 min). Axon initiation identified by the persistent length and position of a dilated protrusion that later transitions to growing axon. Arrowheads show transition from nascent axon to growth phase. |

A. Image sequence from confocal time lapse shows a Rohon‐Beard neuron labelled with membrane and centrosome markers during the initiation of the ascending (0 m), descending (1 h10 min) and peripheral axons (3 h 50 min), and during axon pathfinding. The centrosome is located away from the base of each axon but moves close to the peripheral axon during pathfinding. Images are maximum projections from confocal z‐stacks. Scale bar = 10 μm. B. Graph showing distance between centrosome and base of the axon at time of initiation of each axon ( C. Plots showing the positions of the centrosome and base of the axon at the time of axon initiation relative to the cell centroid at 0,0 for dorsal and transverse views for ascending ( |