
Image
|
Figure Caption
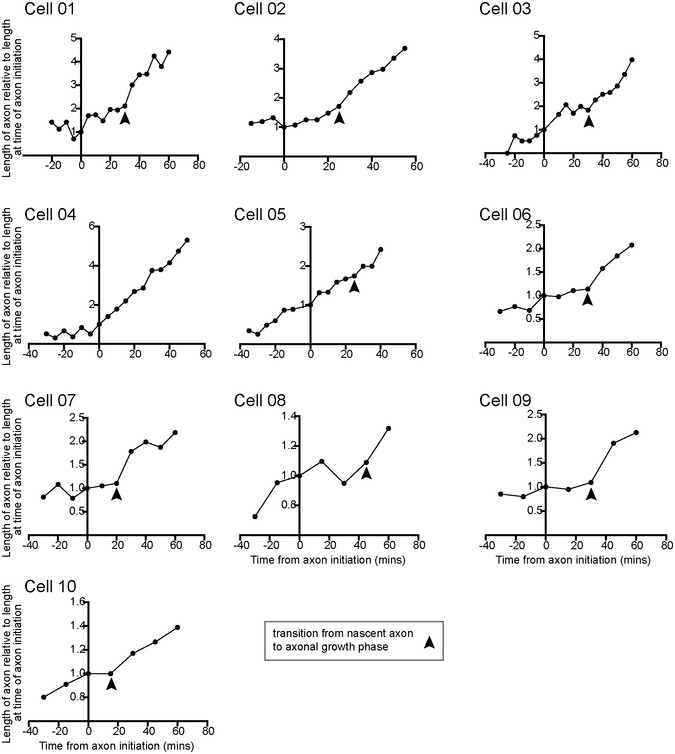
Figure EV1
Graphs showing the maximum protrusion length from ten cells from four experiments before, during (0 min) and after axon initiation. Length is shown relative to length at the time of axon initiation (0 min). Axon initiation identified by the persistent length and position of a dilated protrusion that later transitions to growing axon. Arrowheads show transition from nascent axon to growth phase.
Acknowledgments
This image is the copyrighted work of the attributed author or publisher, and
ZFIN has permission only to display this image to its users.
Additional permissions should be obtained from the applicable author or publisher of the image.
Full text @ EMBO Rep.