
|
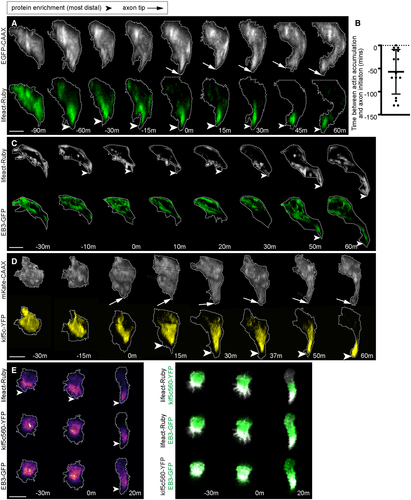
Fig. 4 A. Image sequence from confocal time lapse of a neuron labelled with a membrane marker and lifeact-Ruby before, during (0 m) and after axon initiation. Images are transverse reconstructions from confocal z-stacks.
B. Graph showing time (minutes) between actin accumulation and nascent axon initiation (n = 15 cells from 7 experiments). Bars show mean and standard deviation.
C. Image sequence from confocal time lapse of a neuron labelled with lifeact-Ruby and EB3-GFP before, during (0 m) and after axon initiation. Images are transverse reconstructions from confocal z-stacks.
D. Image sequence from confocal time lapse of a neuron labelled with a membrane marker and Kif5c560-YFP before, during (0 m) and after axon initiation. Images are transverse reconstructions from confocal z-stacks.
E. Three time points from confocal time lapse of a triple labelled neuron before, during (0 m) and after nascent axon initiation. Images to left show the distribution sequence of lifeact-Ruby, kif5c560-YFP and EB3-GFP individually. Dual channel merges to the right show relative locations of pairs of fusion proteins. Images to right are maximum projections of transverse reslices of confocal z-stacks. Data information: All scale bars = 10 μm.
Source data are available online for this figure.