
|
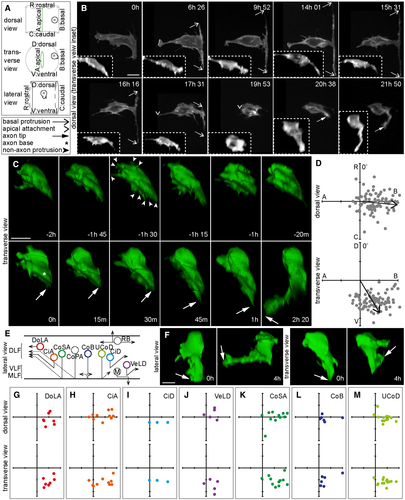
Fig. 1 A. Diagram to illustrate the three different views shown in confocal images and 3D reconstructions throughout this paper, plus legend for arrows and asterisk.
B. Image sequence from confocal time lapse shows the early steps in neuronal differentiation. Two transient basal protrusions are extended along the basal surface of the neural tube (6 h 26 min to 14 h 01 min) and then retracted (15 h 31 min to 17 h 31 min). The apical attachment is also retracted (17 h 31 min to 19 h 53 min; e.g. −1 h 30 min) before the axon is extended (20 h 38 min to 21 h 50 min). Main images are maximum projections and insets are transverse reconstructions from confocal z-stacks.
C. Image sequence from confocal time lapse shows a neuron before, during and after axon initiation. Prior to axon initiation, the neuron extends multiple small, transient preaxonal protrusions (−2 h to −20 min). The nascent axon is extended (0 h) and maintained for a short period (0 h to 30 min) before axon growth begins (45 min to 2 h 20 min). Images are transverse reconstructions from confocal z-stacks.
D. Plots showing axon position on the soma (e.g. asterisk in Fig 1C: 0 h) relative to the cell centroid at 0,0 for dorsal and transverse views (n = 86 cells from 8 experiments). Axon position is not random (dorsal view P < 0.001, mean = 95.3o; transverse view P < 0.001, mean = 148.9o). Data analysed using Moore's modification of the Rayleigh's test.
E. Diagram showing neuronal subtypes in the zebrafish embryo's spinal cord. CiA, circumferential ascending; CiD, circumferential descending; CoB, commissural bifurcating; CoPA, commissural primary ascending; CoSA, commissural secondary ascending; DLF, dorsal longitudinal fasciculus; DoLA, dorsolateral ascending; M, motor; MLF, medial longitudinal fasciculus; RB, Rohon-Beard; UCoD, unilateral commissural descending; VeLD, ventral longitudinal descending; VLF, ventral longitudinal fasciculus.
F. Lateral and transverse reconstructions of DoLA neurons at the time of axon initiation (0 h) and during axon growth (4 h).
G–M. Plots showing axon position on the soma relative to cell centroid at 0,0 in dorsal and transverse views for DoLA (G; n = 7 cells), CiA (H; n = 10 cells), CiD (I; n = 3 cells), VeLD (J; n = 5 cells), CoSA (K; n = 11 cells), CoB (L; n = 6 cells) and UCoD (M; 15 cells) neuronal subtypes. Data information: All scale bars = 10 μm.
Source data are available online for this figure.