
Fig. 3
- ID
- ZDB-FIG-230405-4
- Publication
- Moore et al., 2022 - Microtubules are not required to generate a nascent axon in embryonic spinal neurons in vivo
- Other Figures
- All Figure Page
- Back to All Figure Page
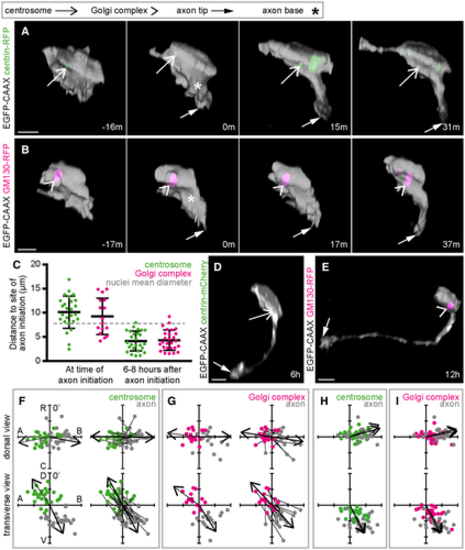
A. Image sequence from confocal time lapse shows a neuron labelled with membrane and centrosome markers before (−16 m), during (0 m) and after axon initiation (15 m, 31 m). The centrosome is located on the opposite side of the cell to the nascent axon. Images are transverse reconstructions from confocal z-stacks. B. Image sequence from confocal time lapse shows a neuron labelled with membrane and Golgi complex markers before (−17 m), during (0 m) and after axon initiation (17 m, 37 m). The Golgi complex is located on the opposite side of the cell to the nascent axon. Images are transverse reconstructions from confocal z-stacks. C. Graph showing distance between centrosome or Golgi complex and base of axon at time of axon initiation and 6–8 h after axon initiation. Bars show mean and standard deviation. At time of axon initiation: centrosome-axon mean = 10.1 μm, s.d. = 3.3, n = 26 cells from three experiments; Golgi complex-axon mean = 9.3 μm, s.d. = 3.8, n = 16 cells from two experiments. At 6–8 h after axon initiation: centrosome-axon mean = 4.2 μm, s.d. = 2.1, n = 26 cells; Golgi complex-axon mean = 4.3 μm, s.d. = 2.1, n = 27 cells. D. Transverse reconstruction from confocal time lapse of a neuron labelled with membrane and centrosome markers during axon growth. E. Transverse reconstruction from confocal time lapse of a neuron labelled with membrane and Golgi complex markers during axon growth. F. Plots showing the positions of the centrosome and base of the axon at the time of axon initiation relative to the cell centroid at 0,0 for dorsal and transverse views (n = 26 cells from three experiments). Left-hand plots: centrosome position is not random (dorsal view P < 0.001, mean = −100.8o; transverse view P < 0.001, mean = −33.7o) and axon position is not random (dorsal view P < 0.001, mean = 101.0o; transverse view P < 0.001, mean = 154.8o; Moore's modification of the Rayleigh's test). Centrosome and axon positions are significantly different (dorsal view 0.001 > P; transverse view 0.001 > P; Moore's test for paired data). Right-hand plots: vectors linking centrosome and nascent axon of the same cell are not random (dorsal view P < 0.001, mean = 91.0o; transverse view P < 0.001, mean = 151.7o; Moore's modification of the Rayleigh's test). G. Plots showing the positions of the Golgi complex (magenta) and base of the axon (grey) at the time of axon initiation relative to the cell centroid at 0,0 for dorsal and transverse views (n = 16 cells from two experiments). Left-hand plots: Golgi complex position is not random (dorsal view 0.01 < P < 0.05, mean = −83.0o; transverse view P < 0.001, mean = −53.4o) and axon position is not random (dorsal view P < 0.001, mean = 89.1o; transverse view P < 0.001, mean = 147.4o; Moore's modification of the Rayleigh's test). Golgi complex and axon positions are significantly different (dorsal view 0.001 > P; transverse view 0.001 > P; Moore's test for paired data). Right-hand plots: vectors linking Golgi complex and nascent axon of the same cell are not random (dorsal view P < 0.001, mean = 98.5o; transverse view P < 0.001, mean = 156.8o; Moore's modification of the Rayleigh's test). H. Plots showing the positions of the centrosome and base of the axon 6–12 h after axon initiation relative to the cell centroid at 0,0 for dorsal and transverse views (n = 26 cells). Centrosome position is not random (dorsal view P < 0.001, mean = 67.7o; transverse view P < 0.001, mean = 151.6o). Axon position is not random (dorsal view P < 0.001, mean = 74.0o; transverse view P < 0.001, mean = 153.7o; Moore's modification of the Rayleigh's test). Centrosome and axon positions are not significantly different (dorsal view 0.5 < P; transverse view 0.1 < P < 0.5; Moore's test for paired data). I. Plots showing the positions of the Golgi complex and base of the axon 6–12 h after axon initiation relative to the cell centroid at 0,0 for dorsal and transverse views (n = 27 cells). Golgi complex position is not random (dorsal view P < 0.001, mean = 79.9o; transverse view P < 0.001, mean = 149.9o). Axon position is not random (dorsal view P < 0.001, mean = 76.0o; transverse view P < 0.001, mean = 153.9o; Moore's modification of the Rayleigh's test). Golgi complex and axon positions are different only in transverse view (dorsal view 0.5 < P; transverse view 0.005 < P < 0.01; Moore's test for paired data). Data information: All scale bars = 10 μm. Source data are available online for this figure. |