
|
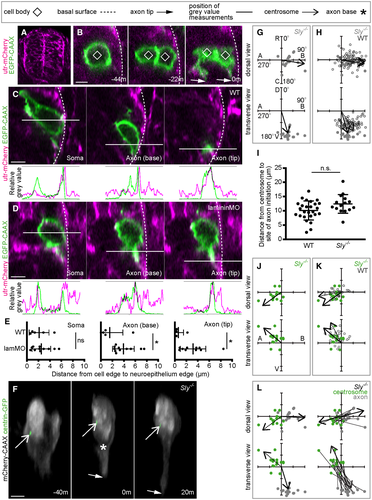
Fig. 6 A. Transverse section from a confocal z-stack showing the whole neural tube of a utr-mCherry embryo, showing localisation to the basal surface.
B. Transverse sections from a confocal z-stack of a nonapical progenitor labelled with a membrane marker in a utr-mCherry embryo to identify the basal surface of the spinal cord. Image sequence from confocal time lapse shows the nonapical progenitor (−44 m) undergoing mitosis to produce two neurons (−22 m), of which one is not in contact with the basal surface. Both neurons extend nascent axons (0 m).
C. Transverse sections from a confocal z-stack of a neuron at the time of nascent axon initiation labelled with a membrane marker in a utr-mCherry embryo to identify the basal surface of the spinal cord. Three different sections show the middle of the soma, the axon initiation site and the axon tip. Green and magenta peaks in graphs show relative positions of cell membrane and basal surface, respectively.
D. Transverse sections from confocal z-stacks of a neuron at the time of nascent axon initiation labelled with a membrane marker in a utr-mCherry embryo injected with lamMO. Three different sections show the middle of the soma, the axon initiation site and the axon tip. Green and magenta peaks in graphs show relative positions of cell membrane and basal surface, respectively.
E. Graphs showing the distance (μm) between the basal edge of the soma, the axon initiation site or the axon tip and the basal surface of the spinal cord. Measurements were performed by measuring between basal-most green and magenta peaks in graphs of relative grey values (C, D). Bars show mean and standard deviation. WT: n = 5 cells from one experiment; lamMO: n = 11 cells from two experiments. Soma: WT mean = 2.007 μm, s.d. = 1.055; lamMO mean = 1.871 μm, s.d. = 1.830. Student's two-tailed test, P = 0.880. Axon initiation site: WT mean = 1.366 μm, s.d. = 3.13; lamMO mean = 2.353 μm, s.d. = 2.125. Student's two-tailed test, P = 0.468. Axon tip: WT mean = 0.637 μm, s.d. = 1.078; lamMO mean = 2.903 μm, s.d. = 2.0433. Student's two-tailed test, P = 0.037.
F. Image sequence from confocal time lapse shows a neuron in a Sly−/− embryo labelled with membrane and centrosome markers before (−40 m), during (0) and after axon initiation (20 m). Images are transverse reconstructions from confocal z-stacks.
G. Plots showing axon position on the soma relative to the cell centroid at 0,0 for dorsal and transverse views in Sly−/− embryos (n = 18 cells from three experiments). Axon position is not random (dorsal view P < 0.001, mean = 98.8o; transverse view P < 0.001, mean = 161.1o; Moore's modification of the Rayleigh's test).
H. Plots showing merge of WT and Sly−/− axon positions on the cell body relative to cell centroid at 0,0 for dorsal and transverse views. Axon positions in WT and Sly−/− are not significantly different in dorsal view (0.2 < P < 0.5) but are in the transverse view (P < 0.001; Batschelet's alternative to the Hotelling test). WT: n = 86 cells from eight experiments; Sly−/−: n = 18 cells from three experiments.
I. Graph showing the distance between centrosome and base of axon at time of axon initiation in WT and Sly−/− embryos. Bars show mean and standard deviation. WT: n = 26 cells from three experiments, mean = 10.13 μm, s.d. = 3.35. Sly−/−: n = 15 cells from two experiments, mean = 12.41 μm, s.d. = 3.281. One-way ANOVA, P = 0.123.
J. Plots showing centrosome position relative to the cell centroid at 0,0 for dorsal and transverse views in Sly−/− embryos (n = 15 cells from two experiments). Centrosome position is not random (dorsal view P < 0.001, mean = −129.0o; transverse view 0.001 < P < 0.005, mean = −57.0o; Moore's modification of the Rayleigh's test).
K. Plots showing merge of WT and Sly−/− centrosome positions on the cell body relative to cell centroid at 0,0 for dorsal and transverse views. Centrosome positions are not significantly different between WT and Sly−/− (dorsal view P > 0.2, transverse view 0.1 < P < 0.2; Batschelet's alternative to the Hotelling test). WT: n = 26 cells from three experiments; Sly−/−: n = 15 cells from two experiments.
L. Plots showing the positions of the centrosome and base of the axon in Sly−/− embryos at the time of axon initiation relative to the cell centroid at 0,0 for dorsal and transverse views (n = 15 cells from two experiments). Left-hand plots: centrosome position is not random (dorsal view P < 0.001, mean = −129.0o; transverse view P < 0.001, mean = −57.0) and axon position is not random (dorsal view P < 0.001, mean = 95.1o; transverse view P < 0.001, mean = 168.8o, Moore's modification of the Rayleigh's test). Centrosome and axon positions are significantly different (dorsal view 0.001 > P; transverse view 0.001 > P; Moore's test for paired data). Right-hand plots: vectors connecting centrosome and nascent axon from the same cell are not random (dorsal view P < 0.001, mean = 66.1o; transverse view P < 0.001, mean = 150.9o). Data information: All scale bars = 5 μm. *P < 0.05.
Source data are available online for this figure.