FIGURE SUMMARY
Title

Putative COVID-19 therapies imatinib, lopinavir, ritonavir, and ivermectin cause hair cell damage: A targeted screen in the zebrafish lateral line

Authors
Coffin, A.B., Dale, E., Doppenberg, E., Fearington, F., Hayward, T., Hill, J., Molano, O.
Source
Full text @ Front. Cell. Neurosci.

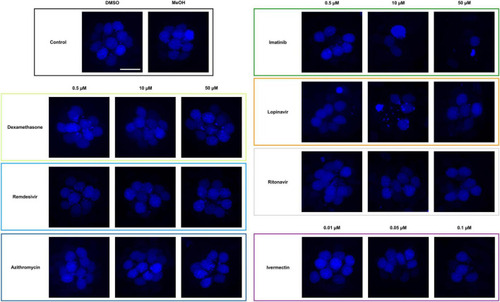
Some COVID-19 drugs are toxic to zebrafish hair cells. Hair cells were live-labeled with DAPI (blue), then fish were treated for 24 h in the indicated drug. The top left panel shows the vehicle controls with a full complement of hair cells. Methanol (MeOH) served as the vehicle for dexamethasone, while DMSO is the vehicle for all other drugs shown here. All other panels show representative confocal images for three concentrations of each drug. Left panels: non-ototoxic drugs dexamethasone, remdesivir, and azithromycin. Right panels: imatinib, lopinavir, ritonavir, and ivermectin all caused hair cell loss. Note that ivermectin was toxic to the animal at high concentrations, so only the non-lethal concentrations were used for this experiment. The scale bar in the upper left = 10 μm and applies to all panels.

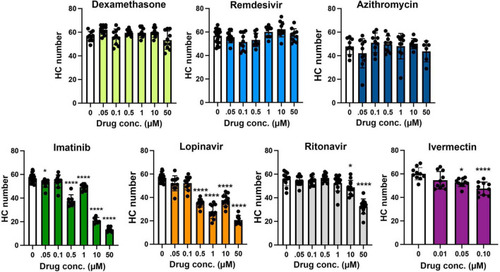
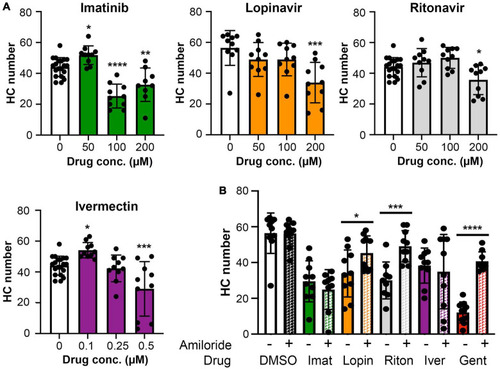
Hair cell quantification following treatment with COVID-19 therapies. Hair cells were counted from images represented in Figure 1. Controls (“0,” white bars) received vehicle, which was methanol for dexamethasone-treated fish and DMSO for all other drugs. Dexamethasone was used as a negative control. Hair cells were counted in five neuromasts per fish and summed to arrive at one value per animal. Data were analyzed by one-way ANOVA followed by Bonferroni-corrected post hoc tests. One-way ANOVA results and sample sizes are as follows: Dexamethasone F(6,63) = 3.53, p = 0.0045, N = 10; Remdesivir F(6,73) = 4.054, p = 0.0015, N = 10–20; Azithromycin F(6,55) = 1.28, p = 0.281, N = 6–10; Imatinib F(6,63) = 188.0, p < 0.0001, N = 6–20; Lopinavir F(6,72) = 80.15, p < 0.0001, N = 9–20; Ritonavir F(6,75) = 27.99, p < 0.0001, N = 11–13; Ivermectin F(3,36) = 8.59, p = 0.0002, N = 10. Asterisks indicate significance differences from vehicle controls. *p < 0.05, ****p < 0.0001. Note that the imatinib and lopinavir experiments were run concurrently and therefore shared control animals. Data are represented as mean ± 1 s.d. and black dots represent individual fish.

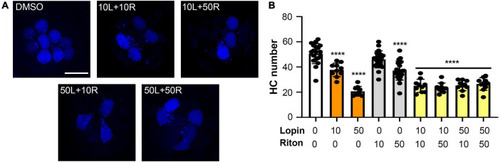
Hair cell toxicity of lopinavir and ritonavir combinations. DAPI-labeled fish were treated for 24 h with 10 and/or 50 μM of lopinavir (L), ritonavir (R), or both drugs. (A) Representative images of each drug combination; representative images of each drug alone are shown in Figure 1. Scale bar in the upper left panel = 10 μm and applies to all images. (B) There was a significant effect of drug treatment on hair cell number [one-way ANOVA, F(8,112) = 42.68, p < 0.0001]. Asterisks indicate significant differences from vehicle controls (****p < 0.0001). There were no differences between fish treated with different combinations of both drugs (10/10, 10/50, 50/10, or 50/50). Statistical analysis for all pairwise comparisons is shown in Supplementary Table 1. Note that the 10 and 50 μM lopinavir data (without ritonavir) are also presented in Figure 2. Data are represented as mean ± 1 s.d. and black dots represent individual fish (N = 9–22/treatment).

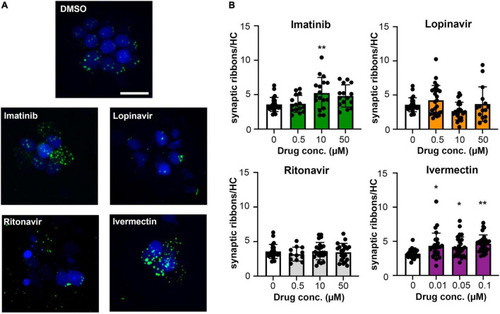
Some COVID-19 drugs alter the number of pre-synaptic ribbons. Rib-GFP fish were live-labeled with DAPI and treated with imatinib, lopinavir, ritonavir, or ivermectin for 24 h. (A) Representative confocal images of DMSO (vehicle) controls and the highest concentration of each COVID-19 drug (50 μM imatinib, lopinavir, and ritonavir; 0.1 μM ivermectin). Hair cell nuclei are labeled in blue, green punctae represent GFP + ribbons. The scale bar in the top image = 10 μm and applies to all panels. (B) Quantified GFP + punctae per remaining hair cell. Data were analyzed by one-way ANOVA followed by Bonferroni-corrected post hoc tests. One-way ANOVA results and sample sizes are as follows: Imatinib F(3,66) = 4.916, p = 0.0038 (N = 5–6 fish, 15–17 neuromasts per group). Lopinavir: F(3,83) = 3.140, p = 0.0296 (N = 7–10 fish, 15–30 neuromasts per group). Ritonavir: F(3,75) = 0.4199, p = 0.7392 (N = 4–7 fish, 12–24 neuromasts per group). Ivermectin: F(3,101) = 4.929, p = 0.0031 (N = 9 fish, 27 neuromasts per group). Asterisks indicate significance differences from vehicle (DMSO) controls. *p < 0.05, **p < 0.01. Note that the imatinib, lopinavir, and ritonavir experiments were run concurrently and therefore shared control animals. Control values for that experiment are not significantly different from control values from the ivermectin experiment (t-test, p = 0.15). Data are represented as mean ± 1 s.d. and black dots represent individual neuromasts.

Most COVID-19 therapies do not cause overall cytotoxicity. (A) Representative images of TUNEL-labeled neuromasts. Hair cells are labeled with DAPI (blue), TUNEL + cells are red. Arrows show examples of DAPI + /TUNEL + hair cells, while arrow heads point to examples of DAPI-/TUNEL + cells (non-hair cells). Images show 10 μM imatinib, lopinavir, and ritonavir, and 0.05 μM ivermectin to show the range of labeling patterns we observed. The scale bar = 10 μm and applies to all panels. (B) Quantification of TUNEL + hair cells (double-labeled cells). There is a significant effect of treatment on the number of TUNEL + HCs [one-way ANOVA, F(8,86) = 3.413, p = 0.0019]. (C) Quantification of TUNEL + non-hair cells (TUNEL + /DAPI) from the same images (62 μm × 62 μm box), to determine overall cytotoxicity of COVID-19 therapies. The x-axis in both panels (B,C) denotes the drug concentration (μM), and C = control. Note the difference in the y-axis scaling between (B) and (C) to reflect the higher number of TUNEL + non-hair cells as compared to hair cells. There is a significant treatment effect on the number of TUNEL + non-hair cells as well [one-way ANOVA, F(8,78) = 5.061, p < 0.0001]. Asterisks indicate significant differences from DMSO controls ***p < 0.001. N = 5–23 fish/treatment. Bars represent mean ± 1 s.d.

(A) High concentrations of imatinib, lopinavir, ritonavir, and ivermectin cause hair cell toxicity over a 6-h incubation period Data were analyzed by one-way ANOVA. Imatinib: F(3,45) = 26.14, p < 0.0001. Lopinavir: F(3,36) = 6.67, p = 0.0011. Ritonavir: F(3,46) = 6.39, p = 0.001 Ivermectin: F(3,46) = 11.14, p < 0.0001. Post hoc comparisons were conducted with Bonferroni-corrected t-test. Asterisks indicate significant differences from vehicle-only controls. *p < 0.05, **p < 0.01, ***p < 0.001, ****p < 0.0001. N = 9–20 fish per treatment. Note that the imatinib, ritonavir, and ivermectin experiments were run concurrently and therefore share vehicle (DMSO) controls. (B) MET channel block attenuates hair cell toxicity of some COVID-19 drugs. 1 mM amiloride was used to block MET channel function and gentamicin was used as a positive control. Paired t-tests (adjusted for multiple comparisons) were used to determine significant differences between amiloride (hashed bars) and non-amiloride (solid bars) treated fish within a single drug. DMSO p = 0.96; imatinib (imat) p = 0.39; lopinavir (lopin) p = 0.04; ritonavir (riton) p = 0.0004; ivermectin (iver) p = 0.64, gentamicin (gent) p < 0.0001. Asterisks indicate significant pairwise differences. N = 9–10 fish per treatment, bars represent mean ± 1 s.d.

Ivermectin is not ototoxic to rats in vivo. (A) Post-treatment ABR thresholds for saline- and ivermectin-treated rats (control: solid line, ivermectin: dotted line; black lines and circles denote males, gray lines, and diamonds denote females). There is no significant treatment effect [two-way ANOVA, treatment effect, F(1,36) = 0.046, p = 0.832]. (B) Representative confocal images from the middle and basal turns of control and ivermectin-treated rats. Phalloidin (green) labels hair bundles, DAPI (blue) labels nuclei. The scale bar in the upper right image = 50 μm and applies to all images. (C) Inner hair cell (left) and outer hair cell (right) quantification in the middle and basal cochlear turns. Counts were performed in both cochleae per animal and averaged. White bars represent control animals, purple bars ivermectin-treated animals. There was no significant difference in IHC number across treatments (middle turn: p = 0.073, basal turn: p = 0.097). Similarly, there was no significant difference in OHC number in either the middle or basal turns (paired t-tests, p = 0.202 and 0.084, respectively). Both male and female animals were included in the experiment and pooled for analysis. N = 5 control, N = 6 ivermectin. All quantitative data in panels (A,C) are presented as mean ± 1 s.d.

Acknowledgments
This image is the copyrighted work of the attributed author or publisher, and ZFIN has permission only to display this image to its users. Additional permissions should be obtained from the applicable author or publisher of the image. Full text @ Front. Cell. Neurosci.