IMAGE

FIGURE 7

ID
ZDB-IMAGE-220914-11
Source
Figures for Coffin et al., 2022
Image
Figure Caption

FIGURE 7

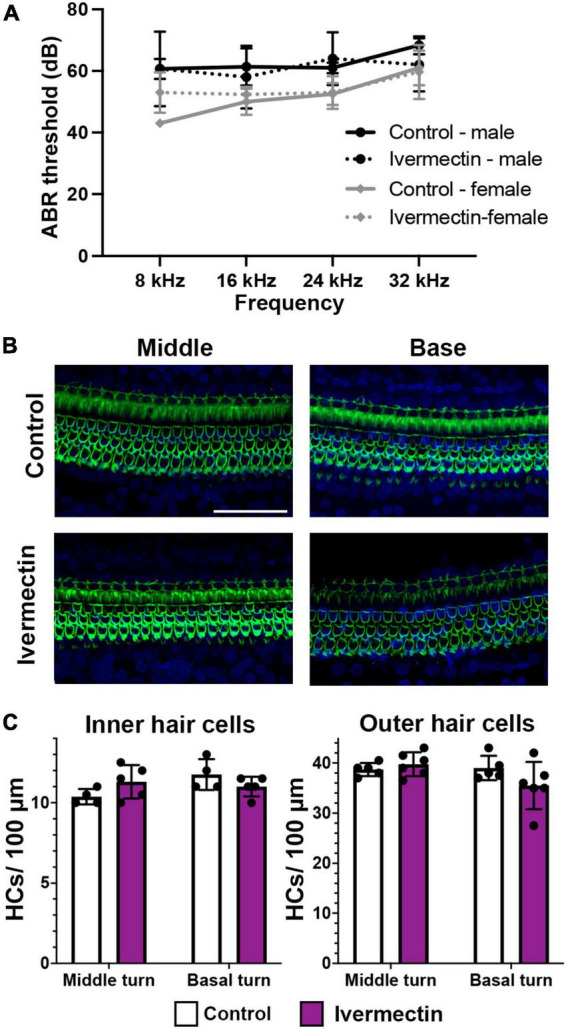
Ivermectin is not ototoxic to rats in vivo. (A) Post-treatment ABR thresholds for saline- and ivermectin-treated rats (control: solid line, ivermectin: dotted line; black lines and circles denote males, gray lines, and diamonds denote females). There is no significant treatment effect [two-way ANOVA, treatment effect, F(1,36) = 0.046, p = 0.832]. (B) Representative confocal images from the middle and basal turns of control and ivermectin-treated rats. Phalloidin (green) labels hair bundles, DAPI (blue) labels nuclei. The scale bar in the upper right image = 50 μm and applies to all images. (C) Inner hair cell (left) and outer hair cell (right) quantification in the middle and basal cochlear turns. Counts were performed in both cochleae per animal and averaged. White bars represent control animals, purple bars ivermectin-treated animals. There was no significant difference in IHC number across treatments (middle turn: p = 0.073, basal turn: p = 0.097). Similarly, there was no significant difference in OHC number in either the middle or basal turns (paired t-tests, p = 0.202 and 0.084, respectively). Both male and female animals were included in the experiment and pooled for analysis. N = 5 control, N = 6 ivermectin. All quantitative data in panels (A,C) are presented as mean ± 1 s.d.

Acknowledgments
This image is the copyrighted work of the attributed author or publisher, and ZFIN has permission only to display this image to its users. Additional permissions should be obtained from the applicable author or publisher of the image. Full text @ Front. Cell. Neurosci.