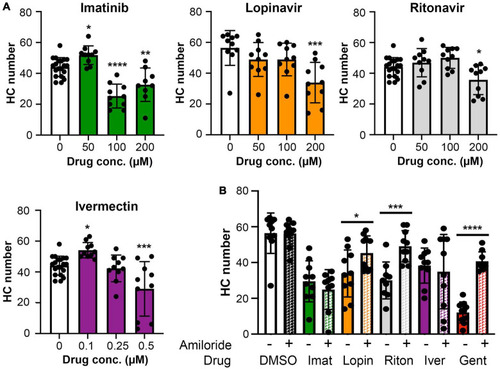
(A) High concentrations of imatinib, lopinavir, ritonavir, and ivermectin cause hair cell toxicity over a 6-h incubation period Data were analyzed by one-way ANOVA. Imatinib: F(3,45) = 26.14, p < 0.0001. Lopinavir: F(3,36) = 6.67, p = 0.0011. Ritonavir: F(3,46) = 6.39, p = 0.001 Ivermectin: F(3,46) = 11.14, p < 0.0001. Post hoc comparisons were conducted with Bonferroni-corrected t-test. Asterisks indicate significant differences from vehicle-only controls. *p < 0.05, **p < 0.01, ***p < 0.001, ****p < 0.0001. N = 9–20 fish per treatment. Note that the imatinib, ritonavir, and ivermectin experiments were run concurrently and therefore share vehicle (DMSO) controls. (B) MET channel block attenuates hair cell toxicity of some COVID-19 drugs. 1 mM amiloride was used to block MET channel function and gentamicin was used as a positive control. Paired t-tests (adjusted for multiple comparisons) were used to determine significant differences between amiloride (hashed bars) and non-amiloride (solid bars) treated fish within a single drug. DMSO p = 0.96; imatinib (imat) p = 0.39; lopinavir (lopin) p = 0.04; ritonavir (riton) p = 0.0004; ivermectin (iver) p = 0.64, gentamicin (gent) p < 0.0001. Asterisks indicate significant pairwise differences. N = 9–10 fish per treatment, bars represent mean ± 1 s.d.
|
